
We recently published an article on the futility of the annual stock market forecast “rodeo” among Wall Street analysts (and it is still safe to say we give these forecasts very little attention). With the rodeo season in full swing as we cross into a new year we asked ourselves how well simply entering the long-term annual return for stocks would perform in such a forecast? It is a well-known fact that in weather forecasting the most accurate forecast for two weeks out and beyond is merely the average temperature for that day, so perhaps the same strategy would be useful for stock market forecasting?
To begin the exercise, we need to determine the data set to be used to calculate the compound average annual return for stocks. We believe the last fifty years (1972-2021) is a good proxy, as the early 70’s were when modern portfolio theory really came into vogue, where markets have been fully developed and are operating efficiently, and the period involves distinct and diverse phases. These phases include supply shocks and inflation in the 70’s, Volker’s defeat of inflation in the 80’s and the bull market that ensued as interest rates came to earth, the go-go 90’s with the birth of the internet and reign (and ultimate crash) of tech stocks, the post 9/11 world of the early 2000’s, the Great Financial Crisis of 2008-2009, and the long bull run for stocks until COVID in 2020.
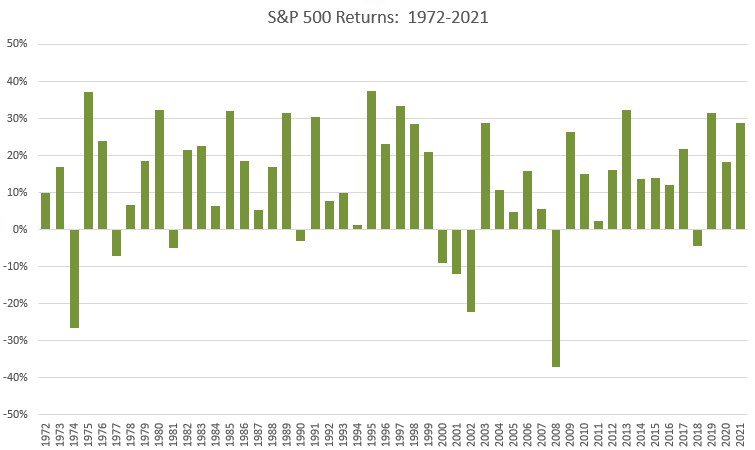
Having settled on the past fifty years as the data set, the compound average total return for stocks during the period is a very respectable 11.9%. For curiosity’s sake, a really long-term period beginning in 1926 forward delivered a compound average total return for stocks of 10.7%. Returns for the 1926-until period returns are often cited as the “average return” for stocks, as the period formed the basis of Ibbotson Associates seminal studies on the capital market risk and return. Markets were much more primitive in the early days, however, so for the exercise we will use 11.9% as the “average return” for stocks.
Returning to the data set of 50 years of performance from 1972-2021, how often did stocks perform in line with their 11.9% average? Never, in fact (although stocks did deliver a 12.0% return in 2016). How about expanding the criteria to plus/minus 1% around the average? Only the 12.0% return in 2016 fits that bill, and a one in fifty batting average pretty much answers our first question regarding how well plugging in the long-term average rate of return would work as an annual forecast. It really doesn’t.
The reason for the failure of the premise is the high variability in stock returns. This variability in returns can be measured, and it defines the inherent risk in stock market investing. Just how risky are stocks? Even if we add or subtract 5% to/from the long term average return of 11.9%, only 13 years of the past 50 meet the wide criteria of returns falling between 6.9% and 16.9%. This leaves 37 years, or 74% of the sample, outside of this sweet spot for stock market returns.
Without losing you with a deep discussion of statistics, the variability in stock returns is quantified by their standard deviation (simply described as the “average of the variability of each of the data points around the central average of the group as a whole”). The beauty of standard deviation is that in a normal set of data, 68% of the data points should fall within +/- one standard deviation from the mean. In our fifty-year set of stock returns the standard deviation is 16.6%, so 68% of the time the stock returns were between -4.7% and 28.5% (plus/minus 1 standard deviation from the 11.9% average). That’s not such a bad deal for investors in and of itself. What is not is the big losers falling outside of one standard deviation. This includes 7 years the S&P 500 lost more than -4.7%, as well as the worst year on record – the 37% loss in 2008 during the Financial Crisis.
What started as a simple exercise morphed into what we hope to be a simplified explanation of the risk of stock market investing. This is not meant to scare or raise alarm, it is to demonstrate the critical importance of managing and limiting portfolio risk. At CCM this is in our DNA, and we do it holistically, which includes minimizing risk at the individual security level, where we screen for strong balance sheets and earnings coupled with wide economic moats for the company’s products, at the industry group level (technology, for instance, is notably risky) and at the multi-asset level – bonds are not perfectly correlated with stocks and a combination of stocks and bonds in a balanced portfolio tends to be less risky than the stock market as a whole. Our concentration on managing risk first is one of the biggest reasons that the pain for our balanced portfolios in the dreadful 2022 market is much less than for our peers, and it will continue to be a core tenet in our total portfolio management system.
CCM Investment Advisers, LLC is a Registered Investment Adviser registered with the U.S. Securities and Exchange Commission (CRD# 105743). The opinions and information contained in this report are for informational purposes only and are not meant to be predictors of future results. Such opinions and information do not constitute an offer or solicitation to provide investment advisory services. Such an offer can only be made in states where CCM Investment Advisers is registered. CCM Investment Advisers does not assume liability for any loss which may result from the reliance by any person upon such information or opinions.
Any type of investing involves risk of loss and there are no guarantees that the strategies described may be successful. Any performance data reported represents historical data and future returns may differ significantly. Past performance does not guarantee future results.
Security, index and economic information are obtained from resources which CCM believes to be accurate but no warrant is made to the accuracy or completeness of the information. Various indices described and discussed herein are unmanaged; investments cannot be made directly into an index.
The S&P 500 Index ® is a readily available, capitalization-weighted index of 500 stocks. The index is designed to measure performance of the broad domestic economy through changes in the aggregate market value of 500 stocks representing all major industries.
Technical Terms (definitions sourced from Investopedia)
The standard deviation is a statistic measuring the dispersion of a dataset relative to its mean and is calculated as the square root of the variance.


