
Despite their less than stellar track records, the investing public still has an almost mythical obsession with the star Wall Street Analysts and their bold calls for the market, whether bullish or bearish. All the while, very little attention is paid to just how downright wrong they can be. In their defense, making a reasonably accurate prediction for the market is an extremely difficult (if not impossible) endeavor.
As posited in Burton Malkeil’s groundbreaking and wildly influential book A Random Walk Down Wall Street, the future path for individual stocks (and ultimately the market) follows a random pattern. Since investors are not able to peer into the future and identify the myriad factors that will push stocks to-and-fro over the forecast period, making accurate predictions in a repeated manner is next to impossible.
While we agree with Malkeil’s random market hypothesis, we believe he is incorrect in suggesting that one cannot consistently outperform market averages. For the years 2001-2011, for instance, CCM’s equity portfolios outperformed the benchmark S&P 500 in 9 of the 11 years. Famed investor Bill Miller beat the market 15 years in a row in 1991-2005 while managing the Legg Mason Value Trust.
We have data available to test the validity of analysts’ market calls and have compiled a list of the forecasts from seventeen high-profile analysts from respected Wall Street firms for the S&P 500’s ending level on 12/31/22. The table also includes their mid-year revisions to the forecasts. The data provide a convincing argument that predicting the future value of a market index is an exercise in futility.
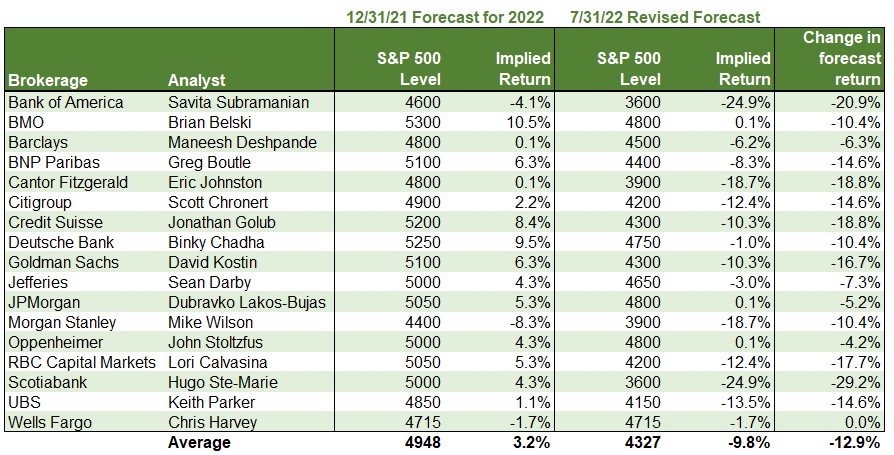
As you see in the section headed “12/31/21 Forecast for 2022”, analysts were not particularly bullish on stocks at the beginning of the year, with an average expected 2022 return for the S&P 500 of only 3.2%. Brian Belski from BMO was the most bullish of the bunch, with a forecast for a 10.5% a return for the year. Mike Wilson of Morgan Stanley was the largest bear, predicting a loss of 8.3% for the Index. The spread between high and low is an outrageous 18.8%. Not long after the ink had dried on the forecast, the market tripped on its random walk when Russia invaded Ukraine. From there, the forecasting business became very tricky.
In the section headed “7/31/22 Revised Forecast”, we move to the analysts’ revised predictions. With over half of the year already in the books, the revised numbers should be more reliable in the end. The most bullish analyst remains Brian Belski of BMO, with a forecast of 0.1% for the year (a 10.4% reduction from his earlier forecast). The most bearish analysts, Savita Subramanian from Bank of America and Hugo Ste-Marie from Scotiabank, both forecast a 24.9% loss for the S&P 500. These are also the two widest spreads between their earlier forecast, with Savita changing his forecast by 20.9% from the earlier stab and Hugo a chasmic 29.2%. Overall, the analyst average is now a forecast loss of 9.8% for the S&P for the year – down 12.9% from their 12/31/21 forecast of a 3.2% positive return for stocks. The magnitude of the change is indicative of just how useless the beginning of year forecast season really is, and at CCM we pay very little attention.
The bottom line is that accurate forecasts of the market are impossible in the long run and investors should pay little attention to such reports hyped in the media. Much of it is click-bait, and the blusterier the forecast the better chance for attracting eyeballs. When 2022 comes to a close, at least one of the seventeen analysts in the study will likely be very close to actual with their forecast. From there, they will be making the talking head media tour as “Analyst of the Year”. Keep in mind a monkey throwing darts at a stock page can pick a decent portfolio from time to time as well, but perhaps we shouldn’t trust him either.
CCM Investment Advisers, LLC is a Registered Investment Adviser registered with the U.S. Securities and Exchange Commission (CRD# 105743). The opinions and information contained in this report are for informational purposes only and are not meant to be predictors of future results. Such opinions and information do not constitute an offer or solicitation to provide investment advisory services. Such an offer can only be made in states where CCM Investment Advisers is registered. CCM Investment Advisers does not assume liability for any loss which may result from the reliance by any person upon such information or opinions.
Any type of investing involves risk of loss and there are no guarantees that the strategies described may be successful. Any performance data reported represents historical data and future returns may differ significantly. Past performance does not guarantee future results.
Security, index and economic information are obtained from resources which CCM believes to be accurate but no warrant is made to the accuracy or completeness of the information. Various indices described and discussed herein are unmanaged; investments cannot be made directly into an index.
The S&P 500 Index ® is a readily available, capitalization-weighted index of 500 stocks. The index is designed to measure performance of the broad domestic economy through changes in the aggregate market value of 500 stocks representing all major industries.
The NASDAQ Composite Index is a readily available, capitalization-weighted index of over 2,500 domestic and international companies listed on the NASDAQ Stock Market.
The Barclay’s Government/Credit Index is the non-securitized component of the U.S. Aggregate Index. The index includes US Treasuries, government-related issues and corporate bonds
The ICE BofAML 0-3 Month US Treasury Bill Index is a subset of ICE BofAML US Treasury Bill Index including all securities with a remaining term to final maturity less than 3 months.
All blended benchmarks are static blends.
Technical Terms (definitions sourced from Investopedia)
Random walk theory suggests that changes in stock prices have the same distribution and are independent of each other.


