2022 GDP: Q1 -1.6% | Q2 -.9%
The US economy contracted for the second quarter in a row leading many to contend that we are in a recession. While two consecutive quarters of negative growth has historically been a hallmark of recession, it is not sufficient or required. In 2001, a recession was declared despite not meeting this standard definition. The National Bureau of Economic Research’s (NBER) Business Cycle Dating Committee is the official arbiter of determining business cycles. They look for sustained and broad-based weakness along with falling employment to determine if the economy has entered a recessionary period. This year’s economic weakness has been primarily concentrated in residential building and government spending, while much of the economy has remained in expansionary territory. In the end, this is an academic exercise. The average consumer is focused on employment and purchasing power of their income.
July Payroll Report 538,000 | Unemployment Rate 3.46%
Recent US job creation has surprised even the most ardent skeptics. The unemployment rate has fallen to a new multi-decade low with record job openings yet to be filled. Wages have also soared over the past year, especially for lower-skilled workers, as employers compete for a shrinking labor pool. Ironically, the problem we face is getting more workers off the sidelines and back into the labor force. As pandemic savings dwindle, this could start to happen in earnest over the coming months. If the employment picture were all one knew about the US economy, you would expect consumers the be buoyant. Unfortunately, there is much more that feeds into consumer sentiment.
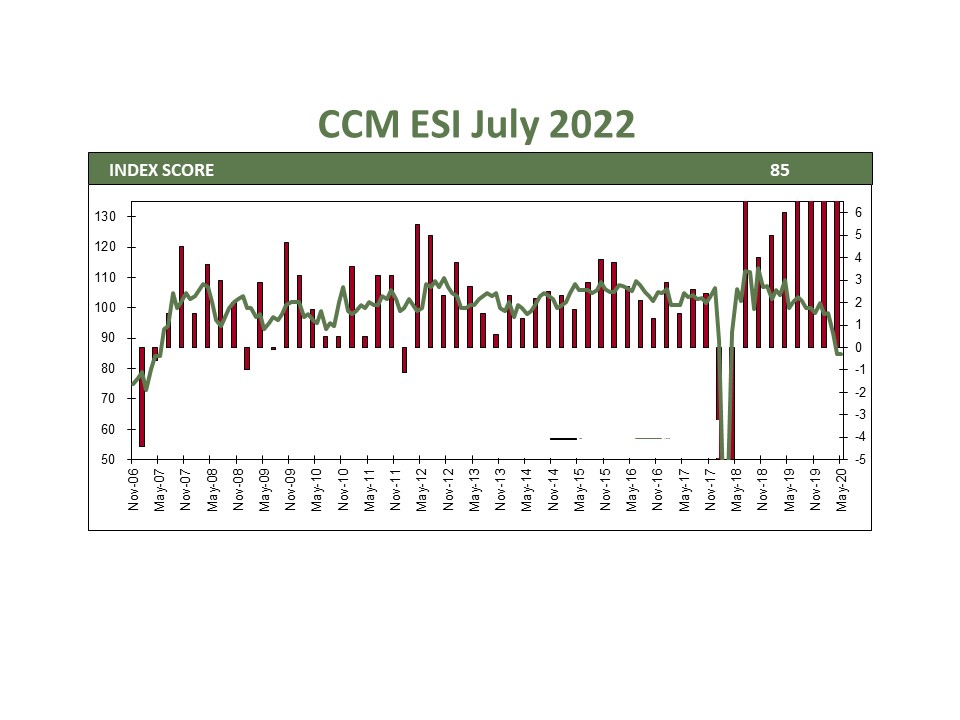
Consumer Confidence 96 | Current: 141 | Expectations: 65
Indicators of consumer attitudes paint a mixed outlook picture of the current economy. The most interesting measure to consider is the Consumer Confidence index. The index is a weighted mix of various factors used to gauge consumer attitudes. Consumers rate the current situation well above average at 141.3, versus the 55-year average of 101. On the other hand, future expectations are very depressed at 65.3 versus an average of 92. The difference between the two measures is near record highs and points to the deleterious effects of inflation on consumer attitudes. Spending remains mixed in this environment depending on where consumers fall on the income scale. The good news is that inflation is starting to fall, which could provide legs for an equity rally.
July CPI 0% | Core.3% | Annual 8.5% | Core Annual 5.9%
July’s CPI report showed the first significant drop in inflation in the past 18 months. Most of the decrease was from lower energy prices which have an outsized effect on consumer psychology. Food prices were up during the month, but recent commodity price drops should begin to show up in August’s inflation report. July also saw a drop in used car prices which drove so much of outsized inflation last year. One area of concern is tenant rents which could remain elevated for months to come. Businesses are also reporting lower prices. The latest ISM reports showed a price decrease for the first time in months. They also show an easing of supply chain-related problems, which should continue to drive down prices. We are hopeful this latest slate of indicators will give the Fed permission to ease up on interest rate increases.
Bottom Line
The economy is showing signs of weakness in the first half of the year. We maintain that this is more of a slowdown in unsustainable housing demand driven by pandemic-related building. Consumers feel strained by the runup in food and energy prices, dampening their outlook. We believe these concerns will begin to wane as inflation continues to fall, especially at the pump and grocery store. These recent positive inflation numbers will ease the path of interest rate hikes setting the stage for a second-half rally in risk assets.
CCM Investment Advisers, LLC is a Registered Investment Adviser registered with the U.S. Securities and Exchange Commission (CRD# 105743). The opinions and information contained in this report are for informational purposes only and are not meant to be predictors of future results. Such opinions and information do not constitute an offer or solicitation to provide investment advisory services. Such an offer can only be made in states where CCM Investment Advisers is registered. CCM Investment Advisers does not assume liability for any loss which may result from the reliance by any person upon such information or opinions.
Any type of investing involves risk of loss and there are no guarantees that the strategies described may be successful. Any performance data reported represents historical data and future returns may differ significantly. Past performance does not guarantee future results.
Security, index and economic information are obtained from resources which CCM believes to be accurate but no warrant is made to the accuracy or completeness of the information. Various indices described and discussed herein are unmanaged; investments cannot be made directly into an index.
The S&P 500 Index ® is a readily available, capitalization-weighted index of 500 stocks. The index is designed to measure performance of the broad domestic economy through changes in the aggregate market value of 500 stocks representing all major industries.
The NASDAQ Composite Index is a readily available, capitalization-weighted index of over 2,500 domestic and international companies listed on the NASDAQ Stock Market.
The Barclay’s Government/Credit Index is the non-securitized component of the U.S. Aggregate Index. The index includes US Treasuries, government-related issues and corporate bonds
The ICE BofAML 0-3 Month US Treasury Bill Index is a subset of ICE BofAML US Treasury Bill Index including all securities with a remaining term to final maturity less than 3 months.
All blended benchmarks are static blends.
Technical Terms (definitions sourced from Investopedia)
The term federal funds rate refers to the target interest rate set by the Federal Open Market Committee (FOMC). This target is the rate at which commercial banks borrow and lend their excess reserves to each other overnight.
The Consumer Price Index (CPI) is a measure of the monthly change in prices paid by consumers. The CPI consists of a bundle of commonly purchased goods and services. The Bureau of Labor Statistics (BLS) calculates the CPI as a weighted average of prices for a basket of goods and services representative of aggregate U.S. consumer spending.
The Producer Price Index (PPI) measures the average change over time in the prices domestic producers receive for their output. It is a measure of inflation at the wholesale level that is compiled from thousands of indexes measuring producer prices by industry and product category. The index is published monthly by the U.S. Bureau of Labor Statistics (BLS)


