Jackson Hole Reality Check
The August speech at Jackson Hole by Federal Reserve Chairman Jerome Powell turned the tide on US markets. Many market participants were hoping for a cut to the Fed Funds rate beginning as early as next year. The speech ruled out that possibility and reset expectations for a restrictive environment until inflation returns to the 2% target. The effects on markets since the address have been consistent with a more hawkish central bank. Yields on US Treasury securities have risen steadily since the speech across all tenors. Interest rate-sensitive sectors have turned down markedly, while defense sectors have held up. We have been writing for months that the most significant risk to markets is a policy mistake and it seems we may be on the cusp of one. Let us explain.
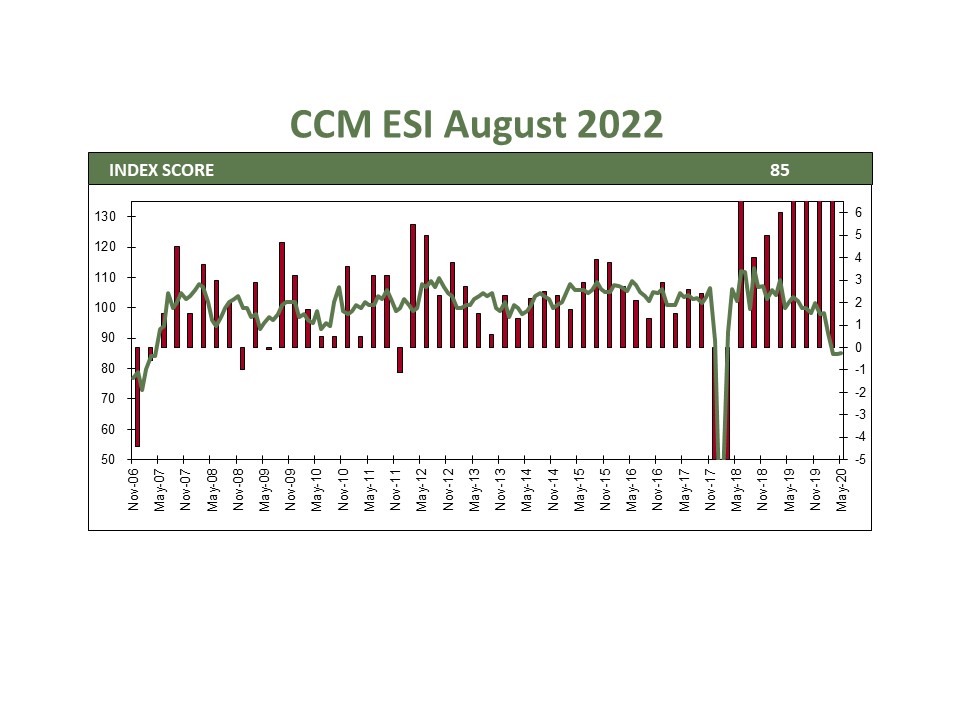
August Employment: 315,000 Jobs | 3.7% Unemployment Rate | Improved Participation
The Fed has two distinct mandates; to maintain maximum employment and to keep inflation and inflation expectations anchored at 2 – 2 ½%. The labor environment is robust and will likely remain so. Inflation is a different story, but not in the way one might assume. It’s important to remember that the Fed has been wrong about inflation throughout the pandemic. First, they were not vocal enough about the risks of overstimulating the economy during a supply crunch. Then they erred by describing inflation as transitory and being unclear about what they meant by that phrasing. Now, it seems, right when inflation is trending down, they are ratcheting up their hawkish rhetoric and warning about a 1970’s style inflation boom. The latest inflation statistics show a consistent pattern of easing inflation. More importantly, inflation expectations have fallen since March of this year, close to the Fed’s target.
Economic Activity: ISM Manufacturing 53% | ISM Non-Manufacturing 57%
We are still hopeful for a “soft landing” for the US economy, but the window of opportunity has been greatly reduced. While the first half’s GDP fell, weakness was largely concentrated in the housing sector. The two ISM surveys are perhaps the best gauge of activity and they both point to solid growth. The ISM component indices show easing pricing pressures along with improving supply chains. This is nothing but good news for inflation moving forward. If improving inflation isn’t enough to give the Fed pause, overseas economic weakness should. China is amidst cascading real estate development company failures and rolling COVID lockdowns. The war in Ukraine shows no signs of abating and is leading to surging energy prices in Europe. Lastly, the strong dollar puts pressure on both developed and emerging economies.
Bottom Line
The Fed dashed hopes of US markets with their hawkish Jackson Hole speech. While inflation continues to be a real threat to the US economy, there are increasing signs that improving supply chains along with rate increases have had a dampening effect. The Fed historically overshoots on rate increases and another policy mistake may be in the offing. The good news is that the market has priced in aggressive Fed action making additional market damage less likely. Our best hope for avoiding a hard landing is a weak CPI report on April 13th, giving the Fed a reason to pause.
CCM Investment Advisers, LLC is a Registered Investment Adviser registered with the U.S. Securities and Exchange Commission (CRD# 105743). The opinions and information contained in this report are for informational purposes only and are not meant to be predictors of future results. Such opinions and information do not constitute an offer or solicitation to provide investment advisory services. Such an offer can only be made in states where CCM Investment Advisers is registered. CCM Investment Advisers does not assume liability for any loss which may result from the reliance by any person upon such information or opinions.
Any type of investing involves risk of loss and there are no guarantees that the strategies described may be successful. Any performance data reported represents historical data and future returns may differ significantly. Past performance does not guarantee future results.
Security, index and economic information are obtained from resources which CCM believes to be accurate but no warrant is made to the accuracy or completeness of the information. Various indices described and discussed herein are unmanaged; investments cannot be made directly into an index.
The S&P 500 Index ® is a readily available, capitalization-weighted index of 500 stocks. The index is designed to measure performance of the broad domestic economy through changes in the aggregate market value of 500 stocks representing all major industries.
The NASDAQ Composite Index is a readily available, capitalization-weighted index of over 2,500 domestic and international companies listed on the NASDAQ Stock Market.
The Barclay’s Government/Credit Index is the non-securitized component of the U.S. Aggregate Index. The index includes US Treasuries, government-related issues and corporate bonds
The ICE BofAML 0-3 Month US Treasury Bill Index is a subset of ICE BofAML US Treasury Bill Index including all securities with a remaining term to final maturity less than 3 months.
All blended benchmarks are static blends.
Technical Terms (definitions sourced from Investopedia)
The term federal funds rate refers to the target interest rate set by the Federal Open Market Committee (FOMC). This target is the rate at which commercial banks borrow and lend their excess reserves to each other overnight.
The Consumer Price Index (CPI) is a measure of the monthly change in prices paid by consumers. The CPI consists of a bundle of commonly purchased goods and services. The Bureau of Labor Statistics (BLS) calculates the CPI as a weighted average of prices for a basket of goods and services representative of aggregate U.S. consumer spending.
The Producer Price Index (PPI) measures the average change over time in the prices domestic producers receive for their output. It is a measure of inflation at the wholesale level that is compiled from thousands of indexes measuring producer prices by industry and product category. The index is published monthly by the U.S. Bureau of Labor Statistics (BLS)


