Is the US Headed for a Recession?
Read or listen to any business news report and the question on everyone’s lips seems to be is the US headed for a recession? While it can’t be ruled out, the evidence of it happening anytime soon isn’t forthcoming. Presently, we estimate the likelihood of a recession to be approximately 40%, anticipating any economic downturn to be brief and mild. Although concerns persist in various areas, such as inflation, interest rate hikes, debt ceiling negotiations, and an expanding banking crisis, we approach the future with cautious optimism, envisioning an improved economic outlook for the remainder of the year.
Given the inherent uncertainty of the future, let’s review the current economic situation using the Conference Board’s Index of Coincident Economic Indicators (CEI) as a guide. Comprised of four components, this index aims to accurately depict the current economic environment.
Payroll Employment:
The labor market remains robust and shows few signs of weakness. In 2023 alone, the labor market has welcomed the addition of 1.1 million jobs, leading to an unemployment rate reaching a historic low of 3.4%—a figure not seen in over 50 years. In the upcoming months, the unemployment rate could potentially decrease further, as there remain 9.6 million job openings with 5.6 million individuals actively seeking employment. While certain sectors have experienced layoffs after scaling up hiring during the COVID crisis, these downsizings have been negligible relative to the overall workforce, and jobless claims remain low.
Real personal income less transfer payments:
This measure captures employee pay on an inflation-adjusted basis. Despite the burden of elevated prices on consumer sentiment, data indicates that wages have managed to keep pace with inflation. Critics often highlight the potential feedback loop between higher wages and increased inflation, drawing parallels to the 1970s. That is clearly not happening in the current environment as wages marginally outstrip inflation by approximately 0.1% over the pandemic period. Coupled with excess savings resulting from the pandemic, this trend bodes well for sustained economic growth.
Real manufacturing and trade sales:
While this component represents the weakest aspect of the CEI, it continues to contribute positively thus far in the year. The graph below illustrates a robust growth trajectory (indicated by the red line) since the end of the Great Financial Crisis. While trade has surpassed pre-COVID levels, we have yet to attain the growth trend line. Deglobalization, even at the margins, will likely prevent this series from returning to trend growth over the short term. Nevertheless, we anticipate that the manufacturing sector will benefit from increased US infrastructure investment and a greater emphasis on onshoring over the medium term.
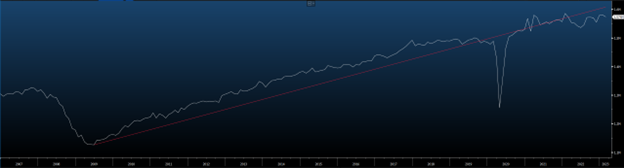
Source: US Census Bureau, Bloomberg, L.P.
Industrial Production:
Due to its inherent volatility, it is best to examine this indicator over longer periods. Throughout this year, growth has exhibited sporadic patterns and is expected to remain so until the economy gains a clearer direction. Growth has remained flat in the past 12 months, decelerating from the rapid expansion observed in the previous three years. While robust production growth is desirable, the positive trend does not suggest an imminent recession.
In conclusion, we find it hard to subscribe to the imminent recession narrative. Consumer spending on dining, shopping, and travel remains robust, indicating healthy economic activity. The primary concern lies in the possibility of an overly aggressive Federal Reserve, which could raise interest rates excessively despite diminishing inflationary pressures. Economists are slowly coming around to this conclusion as well. In aggregate, they have revised their forecasts for growth from 0.3% at the beginning of the year to 1.1% currently. While this growth rate may not be exemplary, it certainly does not signal an impending recession either.
CCM Investment Advisers, LLC is a Registered Investment Adviser registered with the U.S. Securities and Exchange Commission (CRD# 105743). The opinions and information contained in this report are for informational purposes only and are not meant to be predictors of future results. Such opinions and information do not constitute an offer or solicitation to provide investment advisory services. Such an offer can only be made in states where CCM Investment Advisers is registered. CCM Investment Advisers does not assume liability for any loss which may result from the reliance by any person upon such information or opinions.
Any type of investing involves risk of loss and there are no guarantees that the strategies described may be successful. Any performance data reported represents historical data and future returns may differ significantly. Past performance does not guarantee future results.
Security, index and economic information are obtained from resources which CCM believes to be accurate but no warrant is made to the accuracy or completeness of the information. Various indices described and discussed herein are unmanaged; investments cannot be made directly into an index.
The S&P 500 Index ® is a readily available, capitalization-weighted index of 500 stocks. The index is designed to measure performance of the broad domestic economy through changes in the aggregate market value of 500 stocks representing all major industries.
The NASDAQ Composite Index is a readily available, capitalization-weighted index of over 2,500 domestic and international companies listed on the NASDAQ Stock Market.
The Barclay’s Government/Credit Index is the non-securitized component of the U.S. Aggregate Index. The index includes US Treasuries, government-related issues and corporate bonds
The ICE BofAML 0-3 Month US Treasury Bill Index is a subset of ICE BofAML US Treasury Bill Index including all securities with a remaining term to final maturity less than 3 months.
All blended benchmarks are static blends.
Technical Terms (definitions sourced from Investopedia)
The term federal funds rate refers to the target interest rate set by the Federal Open Market Committee (FOMC). This target is the rate at which commercial banks borrow and lend their excess reserves to each other overnight.
The Consumer Price Index (CPI) is a measure of the monthly change in prices paid by consumers. The CPI consists of a bundle of commonly purchased goods and services. The Bureau of Labor Statistics (BLS) calculates the CPI as a weighted average of prices for a basket of goods and services representative of aggregate U.S. consumer spending.
The Producer Price Index (PPI) measures the average change over time in the prices domestic producers receive for their output. It is a measure of inflation at the wholesale level that is compiled from thousands of indexes measuring producer prices by industry and product category. The index is published monthly by the U.S. Bureau of Labor Statistics (BLS)


