Economic growth continues to defy most forecasters’ expectations
The brightest minds in both the government and private sector have called for a recession, but that has not materialized so far. Pessimism has shifted to optimism in recent weeks as more economists publish brighter outlooks for growth. The Blue Chip consensus at the end of June was for zero growth in the third quarter of this year, but the latest survey estimates growth to be 2.2%. The Atlanta GDPNow model is currently forecasting an astonishing 5.6% GDP print. This statistic seems unrealistically high, but several quarters in the late 1990s and early 2000s exceeded this level, so we cannot rule it out.
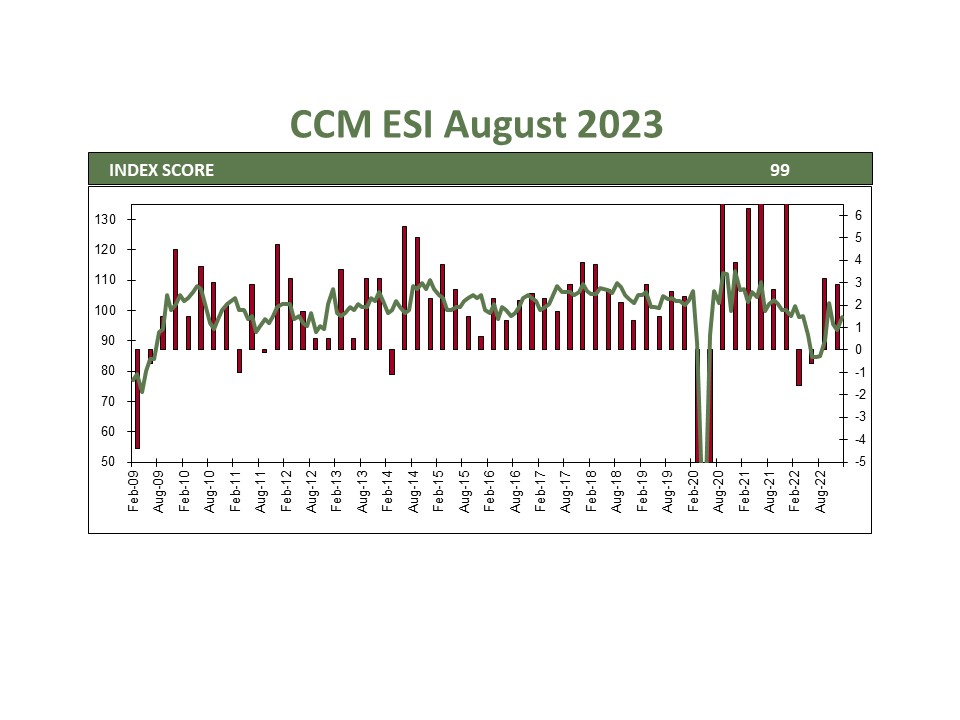
This brings us to another interesting trend we have observed. Most objective growth measures have been healthy this year, though consumer and business survey data show a sullen mood about current and future conditions. This is likely due to the deleterious effects of inflation on consumer sentiment rather than any underlying weakness in the economy. Surveys have highlighted how our fractious political environment is also clouding consumer views on the economy.
On balance, the economy is in a period of expansion, but there are some concerns we should keep an eye on. Below is a review of some of the statistics we are encouraged by and those that give us pause.
Reasons for Optimism
- Employment: The labor market is now above its pre-COVID trend growth and is likely to continue to improve. The unemployment rate ticked up in August to 3.8%, which was expected due to more people entering the workforce. Additionally, wage increases have kept up with inflation in most sectors, allowing consumers to maintain their standard of living.
- Consumer spending: While spending has shifted from goods purchases during the pandemic to services afterwards, American consumers continue to spend. Anyone traveling over the past year can attest to the crowded airports and hotels. Spending could slow in the coming months as savings from the pandemic are depleted, but as long as employment holds up, spending will continue to support growth.
- Construction: Despite high mortgage rates, residential construction has been robust. This has been a surprising source of strength, but some trends help explain it. First, current homeowners are reluctant to sell as they would be paying higher mortgage rates. Second, we need more construction as household formation has outpaced housing supply for over a decade. Lastly, lease rates increased during the pandemic, leading many to switch to home ownership. Commercial construction has also boomed as onshoring has increased the need for manufacturing and warehouse facilities.
- Government spending: The $1 trillion Infrastructure Investment and Jobs Act and $300 billion CHIPS and Science Act will support the economy over the next ten years.
Wall of Worry:
- Government spending: The US government’s debt is now over 100% of GDP, which could drag on growth in the long run. The jury is still out on how much of an impact this will have, but it is something to watch.
- Interest rates: Interest rates are at their highest levels since 2007, which could make it more difficult for businesses to borrow money and invest. However, the Federal Reserve is expected to start raising interest rates more slowly in the coming months, which could help to mitigate this risk.
- Commercial real estate: The work-from-home trend that began during COVID led to much lower occupancy rates. This could lead to bankruptcies for some building owners, but it is too early to say for sure.
Overall, the US economy is in a good position for continued growth in the near term. However, there are risks that could derail this growth, such as rising interest rates or a slowdown in government spending. We will continue to monitor these risks and adjust our outlook accordingly.
CCM Investment Advisers, LLC is a Registered Investment Adviser registered with the U.S. Securities and Exchange Commission (CRD# 105743). Any type of investing involves risk of loss and there are no guarantees that the strategies described on this website or any of the associated literature may be successful. The opinions and information contained in this report are for informational purposes only and are not meant to be predictors of future results. Such opinions and information do not constitute an offer or solicitation to provide investment advisory services. Such an offer can only be made in states where CCM Investment Advisers is registered.
Any type of investing involves risk of loss and there are no guarantees that the strategies described may be successful. Any performance data reported represents historical data and future returns may differ significantly. Past performance does not guarantee future results. CCM Investment Advisers does not assume liability for any loss which may result from the reliance by any person upon such information or opinions.
Security, index and economic information are obtained from resources which CCM believes to be accurate but no warrant is made to the accuracy or completeness of the information. Various indices described and discussed herein are unmanaged; investments cannot be made directly into an index.
The S&P 500 Index ® is a readily available, capitalization-weighted index of 500 stocks. The index is designed to measure performance of the broad domestic economy through changes in the aggregate market value of 500 stocks representing all major industries.
The S&P 500 Growth Index ® is a stock index administered by Standard & Poor’s-Dow Jones Indices. As its name suggests, the purpose of the index is to serve as a proxy for growth companies included in the S&P 500. The index identifies growth stocks using three factors: sales growth, the ratio of earnings change to price, and momentum.
The S&P 500 Value Index ® is a stock index administered by Standard & Poor’s-Dow Jones Indices. As its name suggests, the purpose of the index is to serve as a proxy for value companies included in the S&P 500. The index identifies growth stocks using three factors: the ratios of book value, earnings, and sales to price.
The Barclay’s Government/Credit Index is the non-securitized component of the U.S. Aggregate Index. The index includes US Treasuries, government-related issues and corporate bonds
The 50/50 Balanced Index is an index comprised of 50% S&P 500 stocks and 50% Barclay’s Government/Credit Index bonds.
The NASDAQ Composite Index is a readily available, capitalization-weighted index of over 2,500 domestic and international companies listed on the NASDAQ Stock Market.
The FANG+ Index is a equally-weighted index comprised of Meta, Apple, Amazon, Netflix, Microsoft, Alphabet, Tesla, NVIDIA, Snowflake and AMD. The index is rebalanced quarterly.
The UBS AI Winners basket tracks the performance of 40 US-listed stocks at the forefront of the Generative AI industry. Stock selection is based on input from UBS research analysts, specialty sales, and transcripts/reports. The basket has been optimized for liquidity with initial weights capped at 7% and trades $2.5bn in a day at 20% ADV.
All blended benchmarks are static blends.
Technical Terms:
The term federal funds rate refers to the target interest rate set by the Federal Open Market Committee (FOMC). This target is the rate at which commercial banks borrow and lend their excess reserves to each other overnight.
The Atlanta Fed GDPNow model is a real-time econometric model which forecasts GDP growth in the current quarter.
The Consumer Price Index (CPI) is a measure of the monthly change in prices paid by consumers. The CPI consists of a bundle of commonly purchased goods and services. The Bureau of Labor Statistics (BLS) calculates the CPI as a weighted average of prices for a basket of goods and services representative of aggregate U.S. consumer spending.
The term duration measures how long it takes, in years, for an investor to be repaid a bond’s price by the bond’s total cash flows. Duration can also measure the sensitivity of a bond’s or fixed income portfolio’s price to changes in interest rates.


