COVID REALIGNMENT CONTINUES
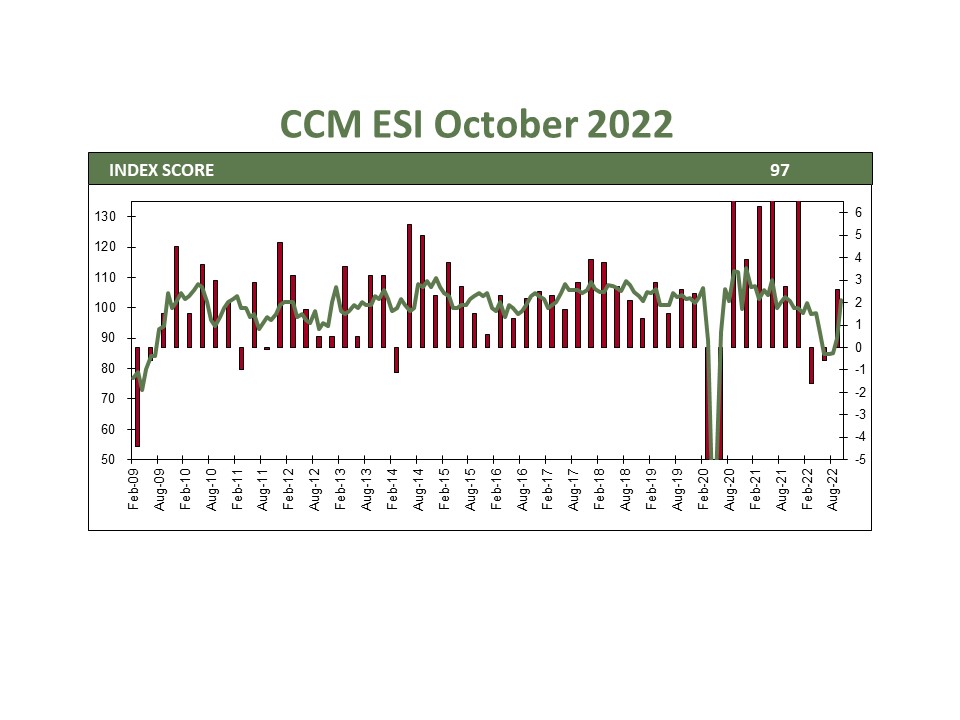
Economic expansion returned in the third quarter after two consecutive declines. The latest GDP report came in at 2.6%, bringing growth to just above zero for the year. Echoes of the COVID era were evident throughout the report as excesses and scarcities moved into balance. Residential construction, a boon during the pandemic, slowed to a halt as higher interest rates and lack of supply put housing out of reach for most. Consumers slowed their goods purchases leading to a significant drawdown in inventories for the quarter. However, the weakness in goods expenditures was balanced by expanding services spending for travel, dining, and other experiences. The most significant positive contributor was in trade, with imports and exports growing as supply chains continued to heal. While growth has been weak this year, context is essential. 2021 saw the strongest annual growth since 1984, making for a particularly challenging comparable period. Add to that interest rate increases by the Federal Reserve at the fastest pace since 1981. A flat growth rate may be the best medicine for the economy as it rebalances.
A TALE OF TWO ECONOMIES
It is the best of times for workers, with almost two job openings for every unemployed. It is the worst of times for consumers as they deal with higher energy, food, and housing costs. If a recession comes in 2023, it will be one of the most anticipated in history. The Fed’s interest rate increases significantly impacted home construction, sales, and vehicle purchases. The jury is still out as to whether we will fall into recession, but history is not our friend. As we have stated in previous writeups, the Fed needs to pause to assess the impact of interest rate increases made to date. If there is a recession it should be brief and mild for a few reasons:
- Economists estimate that roughly ¾ of the pandemic relief payments remain in savings.
- The tight labor market makes companies less likely to lay off existing workers.
- The $1.2T infrastructure bill passed by Congress has barely begun to work its way into spending.
BOTTOM LINE
The first half of 2022 saw the economy shrink, only to come back to even during the third quarter. Consumer spending continues to shift from goods to services causing many retailers to discount their inventories. Supply chains continue to improve, with some producers now seeing surplus deliveries. Job gains have slowed in recent months and there are a few recent signs of slowing inflation. We hope this combination will give the Fed enough impetus to pause their rate hikes. We expect any recession in the coming year will be mild.
CCM Investment Advisers, LLC is a Registered Investment Adviser registered with the U.S. Securities and Exchange Commission (CRD# 105743). The opinions and information contained in this report are for informational purposes only and are not meant to be predictors of future results. Such opinions and information do not constitute an offer or solicitation to provide investment advisory services. Such an offer can only be made in states where CCM Investment Advisers is registered. CCM Investment Advisers does not assume liability for any loss which may result from the reliance by any person upon such information or opinions.
Any type of investing involves risk of loss and there are no guarantees that the strategies described may be successful. Any performance data reported represents historical data and future returns may differ significantly. Past performance does not guarantee future results.
Security, index and economic information are obtained from resources which CCM believes to be accurate but no warrant is made to the accuracy or completeness of the information. Various indices described and discussed herein are unmanaged; investments cannot be made directly into an index.
The S&P 500 Index ® is a readily available, capitalization-weighted index of 500 stocks. The index is designed to measure performance of the broad domestic economy through changes in the aggregate market value of 500 stocks representing all major industries.
The NASDAQ Composite Index is a readily available, capitalization-weighted index of over 2,500 domestic and international companies listed on the NASDAQ Stock Market.
The Barclay’s Government/Credit Index is the non-securitized component of the U.S. Aggregate Index. The index includes US Treasuries, government-related issues and corporate bonds
The ICE BofAML 0-3 Month US Treasury Bill Index is a subset of ICE BofAML US Treasury Bill Index including all securities with a remaining term to final maturity less than 3 months.
All blended benchmarks are static blends.
Technical Terms (definitions sourced from Investopedia)
The term federal funds rate refers to the target interest rate set by the Federal Open Market Committee (FOMC). This target is the rate at which commercial banks borrow and lend their excess reserves to each other overnight.
The Consumer Price Index (CPI) is a measure of the monthly change in prices paid by consumers. The CPI consists of a bundle of commonly purchased goods and services. The Bureau of Labor Statistics (BLS) calculates the CPI as a weighted average of prices for a basket of goods and services representative of aggregate U.S. consumer spending.
The Producer Price Index (PPI) measures the average change over time in the prices domestic producers receive for their output. It is a measure of inflation at the wholesale level that is compiled from thousands of indexes measuring producer prices by industry and product category. The index is published monthly by the U.S. Bureau of Labor Statistics (BLS)


