Common Economic Recovery Shapes
When an economy falls into recession and begins to recover, economists often describe the shape of that recovery using letters such as U and V.
- A U-shaped recovery describes a deep downturn followed by a prolonged bottoming-out period before returning to growth. A recent example is the 2008–2009 financial crisis, which saw a steep decline, a long stretch of weak economic activity, and eventually, a strong rebound.
- A V-shaped recovery, by contrast, is sharp and swift. The COVID-19 recession in 2020 is a prime example: the economy plunged rapidly but rebounded just as quickly, helped by massive federal stimulus measures totaling over $2 trillion from the Federal Reserve and U.S. government.
After the COVID rebound, however, the economy began to bifurcate, splitting into two very different experiences. The upper end of the wealth spectrum prospered, while lower-income groups continued to struggle. This uneven pattern is called a K-shaped recovery, and it has persisted to varying degrees ever since.
The main drivers of this divide are employment and wage disparities. By early 2021, high-wage employment had nearly fully recovered, while low-wage jobs remained down 25% from pre-pandemic levels (source: Opportunity Insights, 2021). According to the Bureau of Labor Statistics, real wages for the top 10% of earners rose about 5%, while wages for the bottom 10% were flat.
The booming post-pandemic stock market widened the gap further. From 2019 to 2024, the S&P 500 returned a cumulative 158%, boosting wealth among top earners. Combined with strong wage growth, this produced an estimated $12 trillion increase in wealth for higher-income households (source: Federal Reserve). In contrast, lower-income households, with limited stock ownership, saw less than $1 trillion in gains during the same period.
As of 2025, the K-shaped pattern continues. Upper-income households have benefited from another strong year in the markets, with the S&P 500 up 13.5% for the year through November 21. According to the Fed, the top 10% now own nearly 70% of all U.S. household wealth. Meanwhile, cash strapped lower-income groups face ongoing challenges, including delayed SNAP benefits and rising Affordable Care Act premiums.
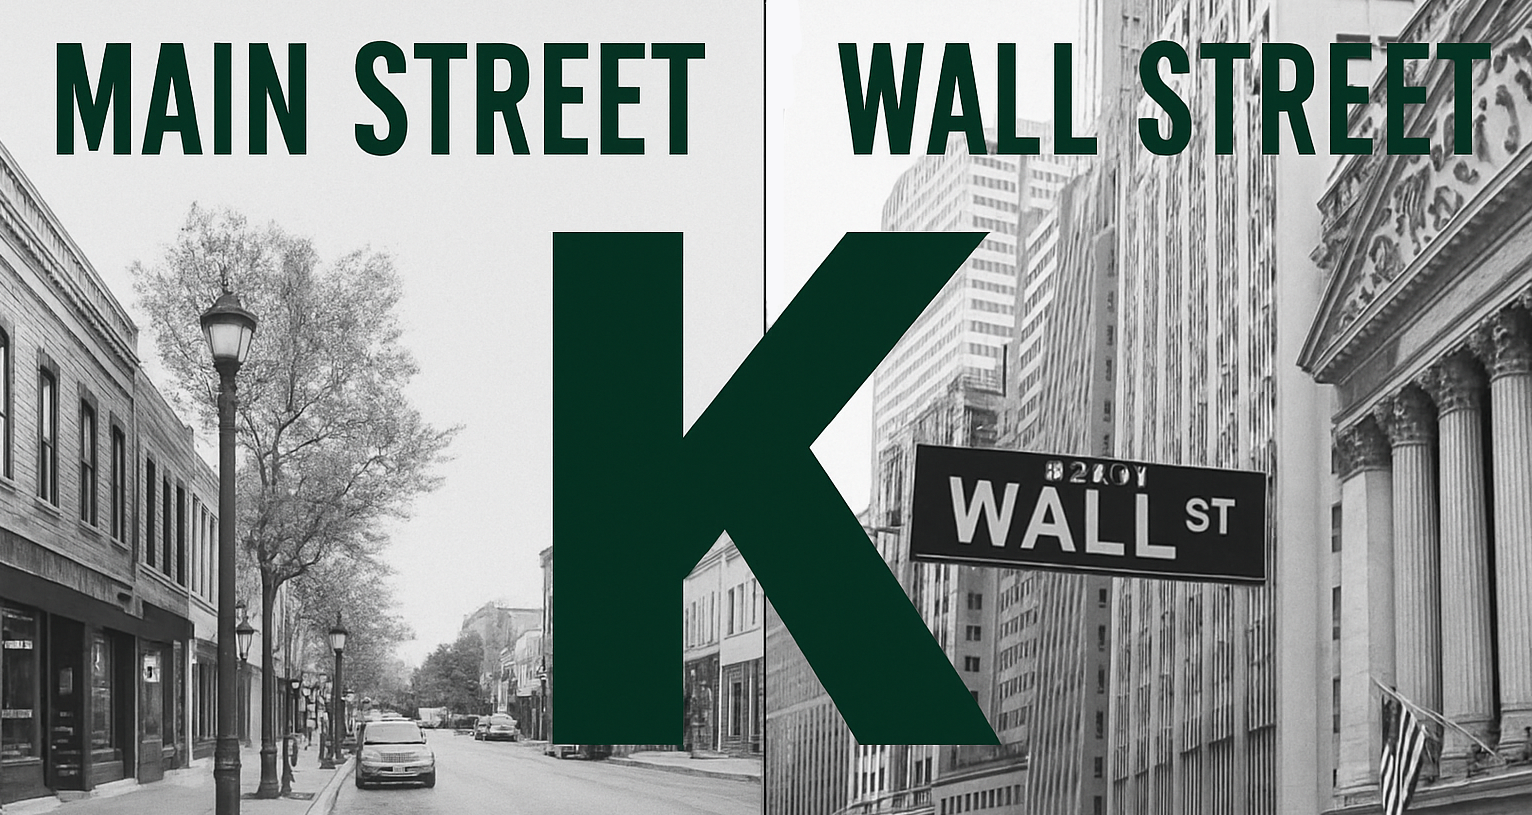
The K-Shaped Economy Meets the K-Shaped Stock Market
The same K-shaped dynamic now appears in the stock market itself. Year-to-date through November 21, the S&P 500 has returned 13.5%, but performance varies sharply by sector. The winning industry groups that are driving performance are:
- Communication Services: +27.4%
- Information Technology: +22.3%
- Utilities: +18.9%
These sectors form the top leg of the “K.” As a whole, the rest of the market lags by a significant margin at the bottom of the “K”, with the remaining eight S&P 500 industries posting an average return roughly half that of the S&P 500.
Since 2011, large-cap technology stocks dubbed the “Magnificent Seven” (Amazon, Tesla, Microsoft, NVIDIA, Alphabet, Apple, and Meta) have dominated performance. In 2025, AI-related enthusiasm has expanded this group to include high-profile names such as Palantir, Broadcom, AMD, and Oracle, all of which have posted outsized gains. Interestingly, the traditionally defensive Utilities sector has joined the top performers, fueled by soaring electricity demand from AI data centers.
Investing Implications
As the saying goes, “Markets can remain irrational longer than investors can remain solvent.” Whether current valuations constitute a bubble is debatable (and recent price action favors the bears’ argument), but price/earnings multiples for top-of-the-K companies are undeniably stretched. For example, the multiple for Palantir now exceeds 350X, which we deem to be ridiculous.
At CCM, we are amazed by the potential for AI and use it regularly in our work (AI aided in researching this report and generated the “Main Street/Wall Street” header graphic). However, we believe a high-profile AI setback, potentially from OpenAI or another major player, could easily disrupt momentum. As value-oriented investors, we have begun the process of reducing exposure to AI-driven names and reallocating toward defensive, attractively priced securities. While momentum continues to favor AI leaders in the near term, no tree grows to the sky. As such, we are gradually lowering the overall risk profile of our model equity portfolio. Full disclosure, though, even the most conservative mix is still subject to the inherent risk of the equity market.
CCM Investment Advisers, LLC is a Registered Investment Adviser registered with the U.S. Securities and Exchange Commission (CRD# 105743). Any type of investing involves risk of loss and there are no guarantees that the strategies described on this website or any of the associated literature may be successful. The opinions and information contained in this report are for informational purposes only and are not meant to be predictors of future results. Such opinions and information do not constitute an offer or solicitation to provide investment advisory services. Such an offer can only be made in states where CCM Investment Advisers is registered.
Any type of investing involves risk of loss and there are no guarantees that the strategies described may be successful. Any performance data reported represents historical data and future returns may differ significantly. Past performance does not guarantee future results. CCM Investment Advisers does not assume liability for any loss which may result from the reliance by any person upon such information or opinions.
Security, index and economic information are obtained from resources which CCM believes to be accurate but no warrant is made to the accuracy or completeness of the information. Various indices described and discussed herein are unmanaged; investments cannot be made directly into an index. Indices do not incur fees that reduce performance. The performance and volatility of an index or mix of indices will not be the same as a CCM client account.
The S&P 500 Index ® is a readily available, capitalization-weighted index of 500 stocks. The index is designed to measure performance of the broad domestic economy through changes in the aggregate market value of 500 stocks representing all major industries.
The Magnificent Seven are the seven largest stocks as measured by market capitalization in the United States. The Bloomberg Magnificent 7 Total Return Index is an equal-dollar weighted equity benchmark consisting of a fixed basket of the seven largest market capitalization companies classified in the United States.
The Barclay’s Government/Credit Index is the non-securitized component of the U.S. Aggregate Index. The index includes US Treasuries, government-related issues and corporate bonds.
Corporate bonds returns and U.S. Government bond returns reference the Bloomberg U.S. Corporate Total Return Index and Bloomberg U.S. Government Total Return Index, respectively.
The 50/50 Balanced Index is an index comprised of 50% S&P 500 stocks and 50% Barclay’s Government/Credit Index bonds.
The NASDAQ Composite Index is a readily available, capitalization-weighted index of over 2,500 domestic and international companies listed on the NASDAQ Stock Market.
Equity index valuation and earnings statistics are calculated using the Bloomberg Professional Service unless otherwise indicated.
All blended benchmarks are static blends.
Technical Terms:
The term federal funds rate refers to the target interest rate set by the Federal Open Market Committee (FOMC). This target is the rate at which commercial banks borrow and lend their excess reserves to each other overnight.
The Atlanta Fed GDPNow model is a real-time econometric model which forecasts GDP growth in the current quarter.
The Dividend Discount Model is a quantitative model used to predict the price of stocks based on the theory its price worth the sum of all future dividends discounted back to their present value.
The Consumer Price Index (CPI) is a measure of the monthly change in prices paid by consumers. The CPI consists of a bundle of commonly purchased goods and services. The Bureau of Labor Statistics (BLS) calculates the CPI as a weighted average of prices for a basket of goods and services representative of aggregate U.S. consumer spending.
The Producer Price Index (PPI) is a measure of inflation at the wholesale level. It’s compiled from thousands of indexes that measure producer prices by industry and product category and is published monthly by the U. S. Bureau of Labor Statistics (BLS)
The term duration measures how long it takes in years for an investor to be re-paid a bond’s price by the bond’s total cash flows. Duration can also measure the sensitivity of a bond’s or fixed income portfolio’s price to changes in interest rates.
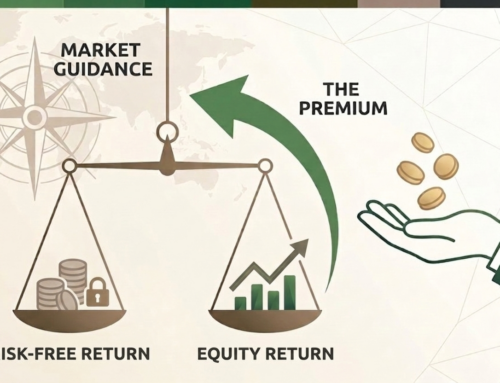
The term equity risk premium refers to the excess return over bonds that investors demand to compensate for the greater risk for stocks.
The ISM Manufacturing index, also known as the purchasing managers’ index (PMI), is a monthly indicator of U.S. economic activity based on a survey of purchasing managers at manufacturing firms nationwide The ISM Services index is based on surveys sent to purchasing and supply companies of more than 400 services firms. Both are considered to be key indicators of the state of the U.S. economy.