
X Marks The Spot
In common parlance, “X Marks the Spot” typically conjures up images of pirates and buried treasure. At the moment, however, it points to a fiscal ticking time bomb.
The financial crowd is fond of acronyms, so if you’ve been seeing “X-Date” in the news lately but not exactly sure what it refers to, fear not. X-Date is simply the day when the U.S. Treasury will exhaust its extraordinary measures as it relates to breaching the debt limit.
On December 16, 2021, lawmakers raised the debt limit by $2.5 trillion to a total of $31.4 trillion. While it somewhat flew under the radar, the Treasury officially reached this limit on January 19, 2023. At that time, the Treasury announced a “debt issuance suspension period” during which it can take “extraordinary measures” to borrow additional funds to continue paying its bills without breaching the debt ceiling.
What extraordinary measures are available? Until Congress passes legislation to raise or suspend the debt limit, they may take any/all of the following measures:
- Suspend the investments of the Thrift Savings Plan’s G Fund. Otherwise rolled over or reinvested daily, those investments totaled $169 billion as of January 31, 2023.
- Suspend the investments of the Exchange Stabilization Fund. Otherwise rolled over daily, such investments totaled $17 billion as of January 31, 2023.
- Suspend the issuance of new securities for the Civil Service Retirement and Disability Fund (CSRDF) and the Postal Service Retiree Health Benefits Fund (PSRHBF), which total about $4 billion each month, and suspend semiannual interest payments to those funds, which are expected to total $12 billion on June 30, 2023.
- Redeem, in advance, securities held by the CSRDF and the PSRHBF in amounts equal in value to benefit payments that are due in the near future. CBO estimates that such payments amount to about $8 billion per month.
- Exchange Federal Financing Bank securities for Treasury securities held by the CSRDF. Approximately $10 billion in securities was available to be exchanged as of January 31, 2023.
(Source: https://www.cbo.gov/publication/58945)
The Treasury can also use any available cash to fund its expenses. As of January 31, 2023, the Treasury had nearly $568 billion in cash.
At the beginning of the year, both Treasury Secretary Janet Yellen and the CBO estimated these extraordinary measures would be exhausted sometime between July and September. In the last few weeks, both have revised their projections to sometime in June. Secretary Yellen recently wrote a letter to Congress urging expediency, as X-Date could come as soon as June 1st.
If X-Date arrives and the debt limit has not been raised or suspended, the Treasury would not be allowed to issue additional debt, apart from replacing maturing securities. The end result would be delayed payments for government expenses, a default on U.S. Treasury debt, or both. It goes without saying, this would be a catastrophic outcome with potentially disastrous effects on financial markets.
Why do we find ourselves in this situation? Isn’t this tantamount to increasing the limit on your credit card so you can continue spending beyond your means? Well, yes and no.
The United States typically runs a budget deficit – in essence, this means government spending is greater than its revenues (primarily tax receipts). In the last 50 years, the federal government budget has run a surplus only 5 times, most recently in 2001. (Source: https://fiscaldata.treasury.gov/americas-finance-guide/national-deficit/) The difference between spending and revenues is the deficit – the U.S. Treasury fills this gap by issuing debt, primarily Treasury Bills/Bonds. If the Treasury loses its ability to issue additional debt, government spending grinds to a halt. Obviously, the consequences would reach far and wide.
Would requiring reduced spending as part of the negotiation for passing an increase in the debt limit help to reduce or fix the problem? Seems logical, but effectively the answer is “no.” Remember – the expenses the Treasury is paying now were already approved (spent) in the Fiscal Year 2022 budget. The new Fiscal Year doesn’t start until October 1, 2023 – any talk of new fiscal discipline is meaningless until that point.
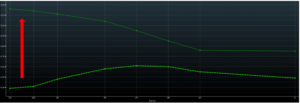
How are markets reacting? The chart below shows the current Treasury Bill curve on top (solid green line) and the same curve one month ago on the bottom (dashed green line). Just one month ago, the curve was relatively flat for maturities ranging from 1-month to 1-year. Today, however, you can observe a kink in the very front end of the curve where rates are notably higher. This indicates investors have a preference for avoiding 1-month Bills due to the potentially impending X-Date in early June.
We can also look at 1-year credit default swap (CDS) spreads as a proxy for how the market is currently pricing the credit risk of a technical default on Treasury debt.
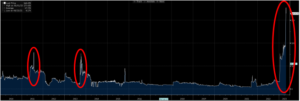
The last ultra-contentious battle over increasing the debt limit was in 2011 – a time when U.S. Treasury debt lost its AAA rating as a result. The vote to increase the debt limit came down to the wire in 2013 as well. As the chart illustrates, while CDS spreads spiked at those times, the increase is substantially more pronounced now. This is likely a combination of the urgency of the situation, as well as a reflection of the mixed parties in the House and Senate increasing the probability of the country’s first technical default. The folks in Washington are fond of taking the vote down to the wire, but keep in mind Congress is only scheduled to be in session for two weeks in May before they adjourn. This only makes a potential resolution more tenuous.
We are faced with a confluence of events. On May 4th, 2023, the FOMC delivered its 10th consecutive rate increase, lifting interest rates by an additional 25 basis points and bringing the target federal funds rate to a range of 5% to 5.25% – a 16-year high. Employment numbers have shown increasing weakness recently, while inflation remains stubbornly sticky. The next key data point is the Non-Farms Payroll report, which will be released on Cinco de Mayo. We will know more in the coming weeks, but rest assured we are keeping a watchful eye over your portfolios.
Any type of investing involves risk of loss and there are no guarantees that the strategies described on this website or any of the associated literature may be successful. Performance data reported represents historical data and future returns may differ significantly. Past performance does not guarantee future results. Please see important disclosures below.
CCM Investment Advisers, LLC is a Registered Investment Adviser registered with the U.S. Securities and Exchange Commission (CRD# 105743). Any type of investing involves risk of loss and there are no guarantees that the strategies described on this website or any of the associated literature may be successful. The opinions and information contained in this report are for informational purposes only and are not meant to be predictors of future results. Such opinions and information do not constitute an offer or solicitation to provide investment advisory services. Such an offer can only be made in states where CCM Investment Advisers is registered.
Any type of investing involves risk of loss and there are no guarantees that the strategies described may be successful. Any performance data reported represents historical data and future returns may differ significantly. Past performance does not guarantee future results. CCM Investment Advisers does not assume liability for any loss which may result from the reliance by any person upon such information or opinions.
Security, index and economic information are obtained from resources which CCM believes to be accurate but no warrant is made to the accuracy or completeness of the information. Various indices described and discussed herein are unmanaged; investments cannot be made directly into an index.
The S&P 500 Index ® is a readily available, capitalization-weighted index of 500 stocks. The index is designed to measure performance of the broad domestic economy through changes in the aggregate market value of 500 stocks representing all major industries.
The S&P 500 Growth Index ® is a stock index administered by Standard & Poor’s-Dow Jones Indices. As its name suggests, the purpose of the index is to serve as a proxy for growth companies included in the S&P 500. The index identifies growth stocks using three factors: sales growth, the ratio of earnings change to price, and momentum.
The S&P 500 Value Index ® is a stock index administered by Standard & Poor’s-Dow Jones Indices. As its name suggests, the purpose of the index is to serve as a proxy for value companies included in the S&P 500. The index identifies growth stocks using three factors: the ratios of book value, earnings, and sales to price.
The Barclay’s Government/Credit Index is the non-securitized component of the U.S. Aggregate Index. The index includes US Treasuries, government-related issues and corporate bonds
The 50/50 Balanced Index is an index comprised of 50% S&P 500 stocks and 50% Barclay’s Government/Credit Index bonds.
The NASDAQ Composite Index is a readily available, capitalization-weighted index of over 2,500 domestic and international companies listed on the NASDAQ Stock Market.
The FANG+ Index is a equally-weighted index comprised of Meta, Apple, Amazon, Netflix, Microsoft, Alphabet, Tesla, NVIDIA, Snowflake and AMD. The index is rebalanced quarterly.
All blended benchmarks are static blends.
Technical Terms:
The term federal funds rate refers to the target interest rate set by the Federal Open Market Committee (FOMC). This target is the rate at which commercial banks borrow and lend their excess reserves to each other overnight.
The Atlanta Fed GDPNow model is a real-time econometric model which forecasts GDP growth in the current quarter.
The Consumer Price Index (CPI) is a measure of the monthly change in prices paid by consumers. The CPI consists of a bundle of commonly purchased goods and services. The Bureau of Labor Statistics (BLS) calculates the CPI as a weighted average of prices for a basket of goods and services representative of aggregate U.S. consumer spending.
The term duration measures how long it takes, in years, for an investor to be repaid a bond’s price by the bond’s total cash flows. Duration can also measure the sensitivity of a bond’s or fixed income portfolio’s price to changes in interest rates.


