MARKET SUMMARY: A Cato Institute poll revealed that 83% of economists believe tariffs are harmful to the economy and should be eliminated. Similarly, a recent CNBC study found that 90% of CFOs predict tariffs will lead to “resurgent inflation.” During his March press conference, Federal Reserve Chairman Jerome Powell used the term “uncertainty” 16 times, highlighting market concerns. The stock market, which disdains both tariffs and uncertainty, reacted negatively. In addition to trade policy, investor uncertainty regarding the potential impact of the Elon Musk-led DOGE initiatives combined for a negative stock market reaction during the first quarter of 2025.
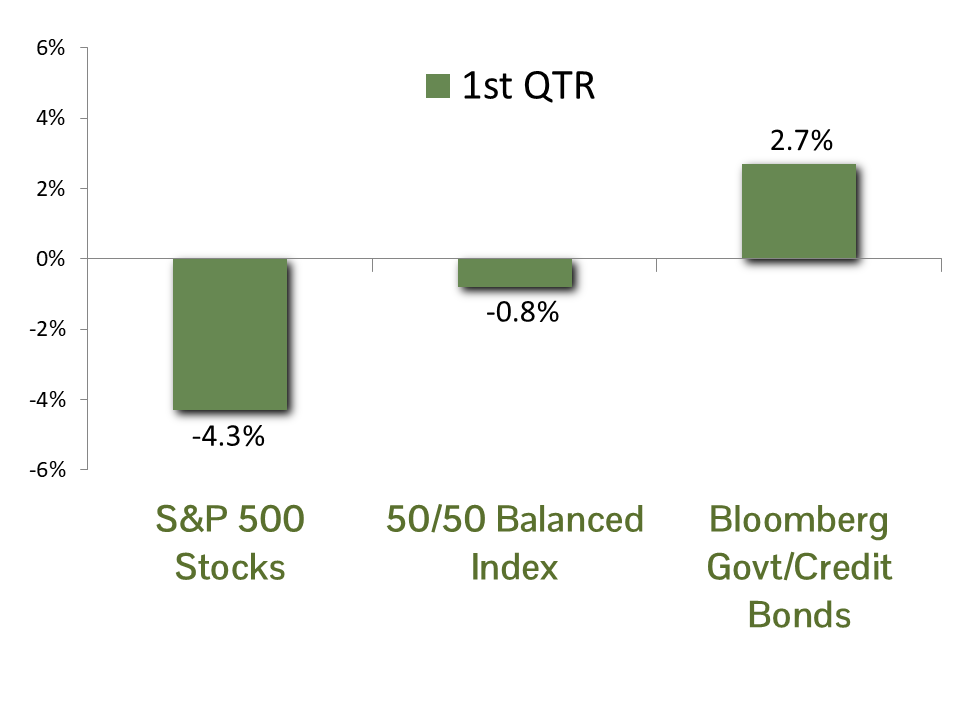
The S&P 500 index reflected these challenges, declining by 4.3% over the period. On March 13, stocks entered “correction” territory, having fallen more than 10% from their peak. A slight recovery followed, but the quarter still ended with the index down 8.7% from its all-time high in February. The selling intensified as we entered the second quarter, though, and as of April 7 stocks briefly entered bear market territory (defined as a drop of over 20% from their high).
The yield on the benchmark 10-year Treasury bond began the year at 4.57%. Inflation expectations rose during the quarter, driven primarily by the potential impact of tariffs, while economic forecasts deteriorated. After over five years of growth, the April 3 update of the Federal Reserve’s GDPNow model now estimates a 2.8% decline in U.S. economic growth for the first quarter. The economic outlook tilted the scale, pushing the 10-year Treasury yield down to 4.22% by the end of the quarter. Due to the inverse relationship between interest rates and bond prices, the Bloomberg Government/Credit bond index posted a solid total return of 2.7% for the first quarter of 2025.
ECONOMIC FORECAST: The likelihood of a U.S. recession has risen considerably, driven by heightened uncertainty surrounding new tariff and trade policies. These developments pose significant risks to business investment, inflation dynamics, and consumer behavior. There is evidence of softer business conditions and emerging pricing pressures, as demonstrated by weaker readings in the March ISM Manufacturing and Services indices. Furthermore, consumer confidence, as measured by the Conference Board, has declined to its lowest level since January 2021, reflecting a sharp deterioration in future expectations—now at a 12-year low. Consumers continue to express concern over rising prices, with inflation expectations climbing to 6% for the coming year.
Despite economic turbulence, the U.S. labor market remains resilient. Employers added 456,000 jobs in the first quarter, and the unemployment rate remained steady at 4.2%. However, recent increases in layoffs warrant attention. On a positive note, wage growth remains robust, with average hourly earnings exceeding core CPI inflation by 0.8% over the past year. Maintaining stable employment levels through the finalization of tariff policy will be crucial in avoiding a recession.
Given the current backdrop of policy uncertainty and potential international responses, forecasting the economic trajectory remains challenging. We continue to hope for constructive policy resolutions but acknowledge that recent market volatility signals a potentially difficult period ahead.
FIXED INCOME STRATEGY: Treasuries outperformed Corporate bonds by 61 basis points in Q1, posting returns of 2.92% and 2.31%, respectively. Corporate underperformance can be attributed to wider credit spreads, as index-level spreads widened to 0.94% from 0.80% at the end of Q4. Despite wider corporate spreads, valuations remain tight relative to their 5-year median of 1.06%.
The drop in 10-year Treasury yields is notable, given the new administration’s focus on bringing the benchmark rate down. Unquestionably, a reduction in yields is helpful in reducing deficit spending on interest costs (which have ballooned to >$1 trillion annually). However, if the rate decline is a result of broad economic weakness, its efficacy will be much more doubtful.
CCM continues to favor an approach that barbells corporate bond exposure in shorter maturities (5 years or less) with U.S. Government bond exposure in the 5 to 10-year maturity range. This provides an embedded hedge against both further equity market weakness and risk-manages the effect of potential spread-widening in corporate bonds. Additionally, we increased our target duration to 4.5 from 4.0 at the end of the previous quarter, which will bolster total returns if yields continue to decline.
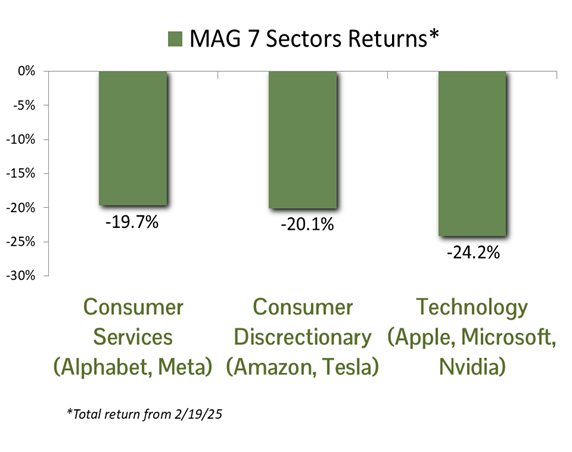
EQUITY STRATEGY: Equity markets are under significant pressure following recent trade policy developments. While the downturn has impacted the broader market, the selling pressure has been notably pronounced within sectors most exposed to the MAG-7 stocks. This selectivity indicates that investors are primarily reducing exposure in areas perceived as most overvalued rather than engaging in indiscriminate selling.
Investor sentiment remains cautious, driven by heightened uncertainty surrounding the ultimate impact of tariffs. Clarity on trade policy negotiations will likely be the key catalyst to restoring market confidence. Earnings expectations have deteriorated steadily since the beginning of the year. First-quarter 2025 earnings growth is projected at 8.3%, down from initial expectations of 10% in January. Similarly, second-quarter growth estimates have been sharply revised downward to 6.3%, significantly below the 10% previously anticipated and markedly lower than the robust 13.9% recorded in the fourth quarter of 2024. Absent meaningful progress on tariff negotiations, we expect further downward revisions to earnings forecasts for both the second quarter and the remainder of 2025.
The market decline thus far reflects concerns surrounding announced tariffs, none of which have yet been implemented. We remain optimistic that trading partners will engage in negotiations to address the administration’s concerns about trade fairness. Given the significant stakes, a negotiated resolution remains the most probable outcome. Nevertheless, market volatility is likely to persist until greater certainty regarding trade policy.
ASSET ALLOCATION: According to our CCM Equity Risk Premium model, the difference between the expected return for stocks and the yield on long-term corporate bonds (the “spread”) decreased significantly in February. This contraction resulted from two key factors. First, after a 50% rise in stocks over the past two years, valuations became increasingly stretched. Consequently, the expected long-term return for stocks dropped from 10.0% to start the year to 8.9% in February. Second, long-term corporate bond yields remained persistently high, hovering around 5.8%. As a result, the spread between these two metrics fell to 3.6%. Our model identified stocks as modestly overvalued and recommended a “baseline” or “benchmark” asset allocation for balanced portfolios managed using our tactical asset allocation system, which adjusts allocations based on prevailing market conditions rather than maintaining a static target.
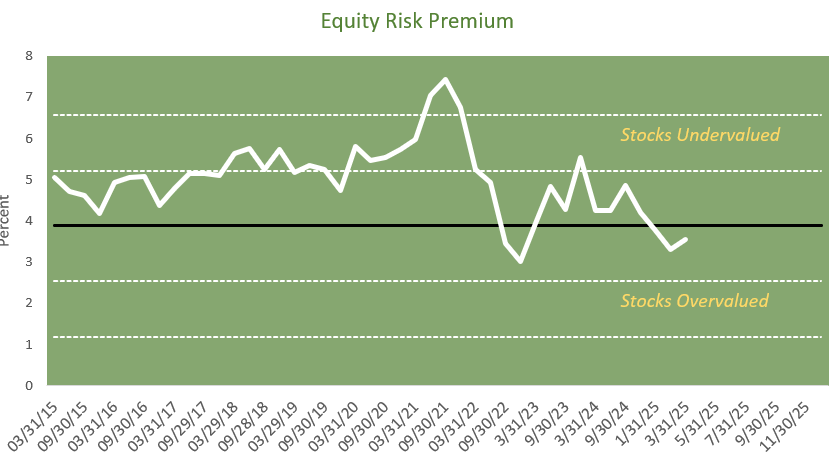
Source: Dividend discount model and bond yields gathered from Bloomberg
Before implementing asset allocation changes, we supplement our quantitative analysis with qualitative factors such as the health of the U.S. economy and investor sentiment. Uncertainty stemming from the growing trade war and government job cuts has weakened consumer confidence, leading to a decline in the outlook for the domestic economy. In response, our conservative risk management approach prompted us to shift tactically managed accounts toward a benchmark asset allocation in early March. These adjustments vary across portfolios depending on factors such as unrealized capital gains in taxable accounts, but equity allocations generally now stand within 5% of benchmark levels.
Economic and market risks have increased alongside heightened chaos and uncertainty originating from Washington. Our recent tactical asset allocation move aims primarily to mitigate these risks. Additional concerns include higher inflation due to tariffs, rising interest rates, and ongoing geopolitical tensions. If your risk tolerance has shifted or your circumstances have changed, please contact your adviser to tailor your portfolio accordingly.
CCM Investment Advisers, LLC is a Registered Investment Adviser registered with the U.S. Securities and Exchange Commission (CRD# 105743). Any type of investing involves risk of loss and there are no guarantees that the strategies described on this website or any of the associated literature may be successful. The opinions and information contained in this report are for informational purposes only and are not meant to be predictors of future results. Such opinions and information do not constitute an offer or solicitation to provide investment advisory services. Such an offer can only be made in states where CCM Investment Advisers is registered.
Any type of investing involves risk of loss and there are no guarantees that the strategies described may be successful. Any performance data reported represents historical data and future returns may differ significantly. Past performance does not guarantee future results. CCM Investment Advisers does not assume liability for any loss which may result from the reliance by any person upon such information or opinions.
Security, index and economic information are obtained from resources which CCM believes to be accurate but no warrant is made to the accuracy or completeness of the information. Various indices described and discussed herein are unmanaged; investments cannot be made directly into an index. Indices do not incur fees that reduce performance. The performance and volatility of an index or mix of indices will not be the same as a CCM client account.
The S&P 500 Index ® is a readily available, capitalization-weighted index of 500 stocks. The index is designed to measure performance of the broad domestic economy through changes in the aggregate market value of 500 stocks representing all major industries.
The S&P 500 Growth Index ® is a stock index administered by Standard & Poor’s-Dow Jones Indices. As its name suggests, the purpose of the index is to serve as a proxy for growth companies included in the S&P 500. The index identifies growth stocks using three factors: sales growth, the ratio of earnings change to price, and momentum.
The S&P 500 Value Index ® is a stock index administered by Standard & Poor’s-Dow Jones Indices. As its name suggests, the purpose of the index is to serve as a proxy for value companies included in the S&P 500. The index identifies growth stocks using three factors: the ratios of book value, earnings, and sales to price.
Bloomberg Magnificent 7 Total Return Index is an equal-dollar weighted equity benchmark consisting of a fixed basket of 7 widely-traded companies classified in the United States.
The Barclay’s Government/Credit Index is the non-securitized component of the U.S. Aggregate Index. The index includes US Treasuries, government-related issues and corporate bonds.
The 50/50 Balanced Index is an index comprised of 50% S&P 500 stocks and 50% Barclay’s Government/Credit Index bonds.
The NASDAQ Composite Index is a readily available, capitalization-weighted index of over 2,500 domestic and international companies listed on the NASDAQ Stock Market.
All blended benchmarks are static blends.
Technical Terms:
The term federal funds rate refers to the target interest rate set by the Federal Open Market Committee (FOMC). This target is the rate at which commercial banks borrow and lend their excess reserves to each other overnight.
The Atlanta Fed GDPNow model is a real-time econometric model which forecasts GDP growth in the current quarter.
The Dividend Discount Model is a quantitative model used to predict the price of stocks based on the theory its price worth the sum of all future dividends discounted back to their present value.
The Consumer Price Index (CPI) is a measure of the monthly change in prices paid by consumers. The CPI consists of a bundle of commonly purchased goods and services. The Bureau of Labor Statistics (BLS) calculates the CPI as a weighted average of prices for a basket of goods and services representative of aggregate U.S. consumer spending.
The term duration measures how long it takes in years for an investor to be re-paid a bond’s price by the bond’s total cash flows. Duration can also measure the sensitivity of a bond’s or fixed income portfolio’s price to changes in interest rates.
The term equity risk premium refers to the excess return over bonds that investors demand to compensate for the greater risk for stocks.
The ISM Manufacturing index, also known as the purchasing managers’ index (PMI), is a monthly indicator of U.S. economic activity based on a survey of purchasing managers at manufacturing firms nationwide The ISM Services index is based on surveys sent to purchasing and supply companies of more than 400 services firms. Both are considered to be key indicators of the state of the U.S. economy.