MARKET SUMMARY: Investors enjoyed a resilient “everything rally” for both the stock and bond markets in 2025. The markets defied fears of a trade war, persistent inflation, a cooling labor market, a record 43-day government shutdown and a potential bubble in artificial intelligence stocks.
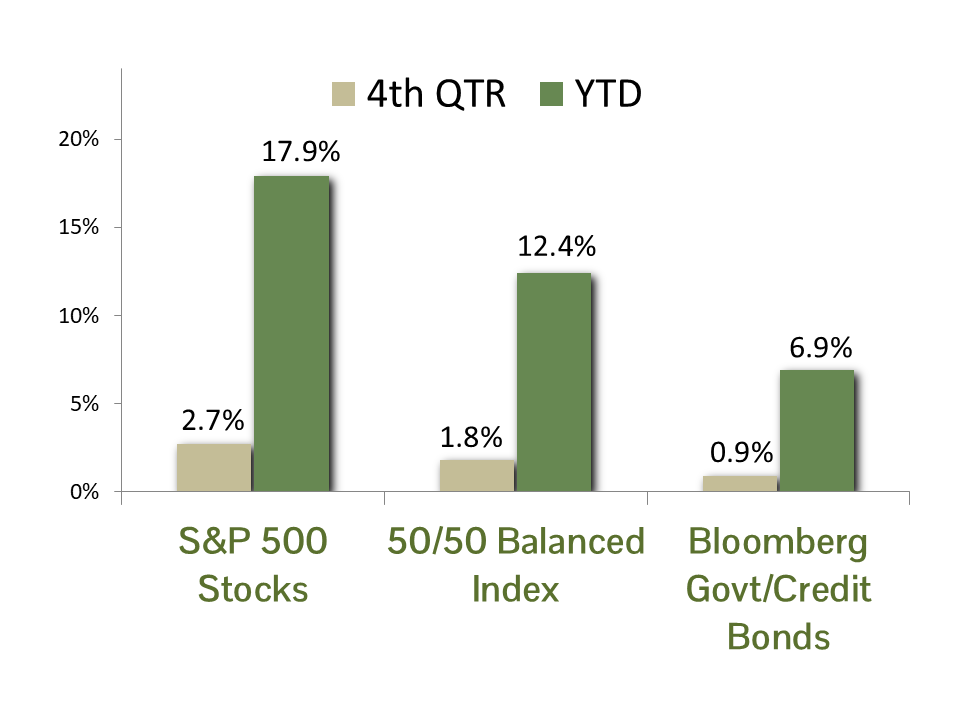
S&P 500 stocks delivered a robust total return of 17.9% for 2025, marking the third consecutive year of double-digit gains. All eleven sectors finished in positive territory. While technology stocks continued to lead, the fourth quarter saw a healthy broadening of market participation. Corporate profits remained a primary driver. According to FactSet estimates, earnings grew more than 8% in the final quarter, helping to justify valuations that remain quite high by historical standards.
As we entered the new year bonds held the dubious distinction of a five-year cumulative return of -0.2% for 2020-2024. In 2025 the bond market reached a significant turning point, however. The recovery was fueled by a pivoting Federal Reserve, which implemented three 25 basis point rate cuts during the second half of the year. The 10-year Treasury yield followed suit, ending the year at 4.18%, down significantly from its January peak of 4.8%. As a result of declining interest rates, fixed income reclaimed its role as a source of real return. As measured by the Bloomberg Gov’t/Credit Master index, the market posted a total return of 6.9% for the year.
ECONOMIC FORECAST: There has been a lot of noise in the GDP data this year, making it difficult to assess growth. The first quarter saw companies boosting inventories to avoid tariffs, only to see purchases collapse in the second quarter. The third-quarter GDP report provided a clearer read on the economy. Growth surprised at 4.3%, driven by consumer spending, which contributed approximately 2.4% of the total. Net trade also improved materially, adding roughly 1.6% to growth as exports rose and imports moderated.
We expect fourth-quarter growth to moderate and likely come in below trend. The government shutdown and its downstream effects, including delayed payments, disrupted data collection, and reduced federal activity, will likely weigh on the result. We expect full-year 2025 GDP growth be in the 2.0%–2.5% range, consistent with a moderately expanding economy.
Surveys for 2026 expect growth in the low 2% range, but we see reason for optimism. Consumers, despite loathing high prices, are in good financial shape, with debt service as a percentage of disposable income near record lows. Tax refunds are expected to be high, which will support discretionary spending. The inflation picture improved in the latest CPI report, with the annual rate falling to 2.7%.
If disinflation continues and labor-market conditions re-accelerate following last year’s softening, economic growth in 2026 could surprise to the upside. While risks remain, the foundation for an above-average growth year is increasingly visible.
FIXED INCOME STRATEGY: U.S. Treasury bonds outperformed Corporate bonds by 0.06% in Q4, posting returns of 0.90% and 0.84%, respectively. However, Corporates outperformed on the year, returning 7.77% vs 6.32% for U.S. Treasuries. For the full year 2025, 2-year yields dropped 0.77%, 10-year yields fell 0.40%, while 30-year yields rose 0.06%.
The Fed Funds futures market continues to price in two additional 0.25% rate cuts by the Federal Reserve for 2026. The FOMC’s “dot plot” supports this forecast. A slowing labor market should, on balance, favor lower interest rates. However, sticky inflation metrics could offset the need for more rate cuts, while persistent deficit spending may provide resistance to lower interest rates, particularly in longer maturities (20+ years).
CCM continues to favor an approach that barbells Corporate bond exposure in shorter maturities (5 years or less) with U.S. Government bond exposure in the 5 to 10-year maturity range. This provides an embedded hedge against potential equity market weakness and risk-manages the effect of potential spread-widening in corporate bonds, which remain richly valued compared to historical metrics. We maintain our duration target at 4.5, which is defensive versus the index (6.13), but still reflects our constructive outlook on fixed income investments.
EQUITY STRATEGY: Investor optimism is high going into 2026. A recent Bloomberg survey found that every major Wall Street strategist expects stocks to move higher this year. This level of consensus is worrying, given lofty valuations and the extent to which market sentiment is driven by Artificial Intelligence (AI) investment. An MIT report titled “State of AI in business 2025” showed that only 5% of AI projects had a meaningful impact on company profits. As the novelty of the technology wears off, the “show me” stage will be crucial for companies to continue investing. Our equity model has exposure across the AI ecosystem, but at a more measured weighting that reflects our focus on valuation discipline and risk management.
S&P 500 equity valuations, as measured by the 12-month blended forward P/E ratio, remain elevated. The metric currently stands at 22.2, or 1.7 standard deviations above the 35-year average. We are somewhat encouraged that above-trend earnings growth forecasts support valuations. It remains to be seen whether the growth assumptions ultimately prove too optimistic. Still, the fact that investors are paying attention to valuations makes us less concerned about a significant correction.
Comparisons to today’s market and the late-1990s internet boom are common in the financial press, but the underlying dynamics differ in essential ways. The dot-com era was characterized by widespread speculation, minimal earnings support, and indiscriminate capital allocation to unproven business models. During the peak of the technology bubble, the forward P/E ratio reached an all-time high of 25.6 before falling to 16.7 in 2003. In contrast, today’s elevated valuations are concentrated in a narrower group of highly profitable, cash-generative companies, where earnings expectations are anchored in fundamentals. That distinction does not eliminate valuation risk, but it does suggest a market environment that is more selective and less speculative than the bubble that ultimately unraveled two decades ago.
ASSET ALLOCATION: The CCM asset allocation model continues to point to a baseline allocation to equities in balanced accounts (although not as strongly as when we made the call to reduce equity exposure in early 2025). The model gave a clear signal then as interest rates increased and the outlook for stocks deteriorated. The case is not as clear-cut currently, as interest rates have trended lower and the expected return on stocks has improved in 2025. This has given us some room to allow equity allocations to drift upwards with market appreciation this year.
The model currently sits below one standard deviation to its long-term mean, which, in isolation, would suggest a modest overweight to equities. We have never mindlessly followed the ERP model when making asset allocation decisions but do consider it a very valuable tool for assessing the relative value of stocks over the longer term. Given the current level of valuations and the fact that market concentration remains at historic highs, we are comfortable with our benchmark allocation call.
Key investing risks include elevated equity valuations versus their historic norms, the potential for unrest in the AI investing space, geopolitical risk (most recently Venezuela) and a resurgence in inflation. If your risk tolerance or circumstances have changed, please contact your adviser to adjust your investment policy accordingly.
CCM Investment Advisers, LLC is a Registered Investment Adviser registered with the U.S. Securities and Exchange Commission (CRD# 105743). Any type of investing involves risk of loss and there are no guarantees that the strategies described on this website or any of the associated literature may be successful. The opinions and information contained in this report are for informational purposes only and are not meant to be predictors of future results. Such opinions and information do not constitute an offer or solicitation to provide investment advisory services. Such an offer can only be made in states where CCM Investment Advisers is registered.
Any type of investing involves risk of loss and there are no guarantees that the strategies described may be successful. Any performance data reported represents historical data and future returns may differ significantly. Past performance does not guarantee future results. CCM Investment Advisers does not assume liability for any loss which may result from the reliance by any person upon such information or opinions.
Security, index and economic information are obtained from resources which CCM believes to be accurate but no warrant is made to the accuracy or completeness of the information. Various indices described and discussed herein are unmanaged; investments cannot be made directly into an index. Indices do not incur fees that reduce performance. The performance and volatility of an index or mix of indices will not be the same as a CCM client account.
The S&P 500 Index ® is a readily available, capitalization-weighted index of 500 stocks. The index is designed to measure performance of the broad domestic economy through changes in the aggregate market value of 500 stocks representing all major industries.
The Magnificent Seven are the seven largest stocks as measured by market capitalization in the United States. The Bloomberg Magnificent 7 Total Return Index is an equal-dollar weighted equity benchmark consisting of a fixed basket of the seven largest market capitalization companies classified in the United States.
The Barclay’s Government/Credit Index is the non-securitized component of the U.S. Aggregate Index. The index includes US Treasuries, government-related issues and corporate bonds.
Corporate bonds returns and U.S. Government bond returns reference the Bloomberg U.S. Corporate Total Return Index and Bloomberg U.S. Government Total Return Index, respectively.
The 50/50 Balanced Index is an index comprised of 50% S&P 500 stocks and 50% Barclay’s Government/Credit Index bonds.
The NASDAQ Composite Index is a readily available, capitalization-weighted index of over 2,500 domestic and international companies listed on the NASDAQ Stock Market.
Equity index valuation and earnings statistics are calculated using the Bloomberg Professional Service unless otherwise indicated.
All blended benchmarks are static blends.
Technical Terms:
The term federal funds rate refers to the target interest rate set by the Federal Open Market Committee (FOMC). This target is the rate at which commercial banks borrow and lend their excess reserves to each other overnight.
The Atlanta Fed GDPNow model is a real-time econometric model which forecasts GDP growth in the current quarter.
The Dividend Discount Model is a quantitative model used to predict the price of stocks based on the theory its price worth the sum of all future dividends discounted back to their present value.
The Consumer Price Index (CPI) is a measure of the monthly change in prices paid by consumers. The CPI consists of a bundle of commonly purchased goods and services. The Bureau of Labor Statistics (BLS) calculates the CPI as a weighted average of prices for a basket of goods and services representative of aggregate U.S. consumer spending.
The Producer Price Index (PPI) is a measure of inflation at the wholesale level. It’s compiled from thousands of indexes that measure producer prices by industry and product category and is published monthly by the U. S. Bureau of Labor Statistics (BLS)
The term duration measures how long it takes in years for an investor to be re-paid a bond’s price by the bond’s total cash flows. Duration can also measure the sensitivity of a bond’s or fixed income portfolio’s price to changes in interest rates.
The term equity risk premium refers to the excess return over bonds that investors demand to compensate for the greater risk for stocks.
The ISM Manufacturing index, also known as the purchasing managers’ index (PMI), is a monthly indicator of U.S. economic activity based on a survey of purchasing managers at manufacturing firms nationwide The ISM Services index is based on surveys sent to purchasing and supply companies of more than 400 services firms. Both are considered to be key indicators of the state of the U.S. economy.