MARKET SUMMARY: The 2024 U.S. election had conflicting effects on the stock and bond markets in the fourth quarter. Stock investors responded positively to the prospect of lower tax rates and deregulation, expecting a boost in corporate profits. In contrast, bondholders were concerned about both the potential for increased Federal deficits due to lower corporate tax rates and the impact of higher tariffs and deportations on inflation.
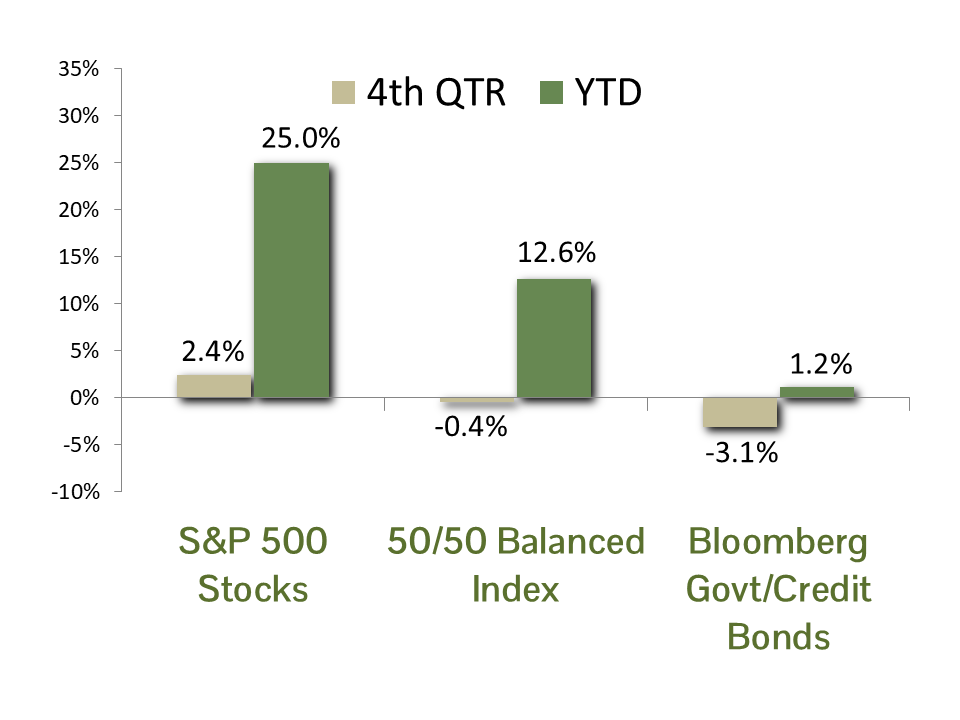
For the stock market, robust economic growth fueled investor enthusiasm following the election. The stock market hit numerous all-time highs in the fourth quarter, achieving its 57th record of the year on December 6. Although rising interest rates and some second thoughts about the election caused a 3.6% pullback to close of the year, the S&P 500 Index still ended the quarter with a solid 2.4% gain, bringing its 2024 total return to 25.0%. This follows a 26.3% gain in 2023, marking the best two-year performance since 1997-1998.
The largest seven technology companies, often called the Magnificent 7, were standout performers in 2024. According to the Bloomberg Magnificent 7 Total Return Index, this elite group saw a 67.3% increase for the year. Artificial intelligence leader NVIDIA led the pack with an impressive 171% return. Because the S&P 500 Index is weighted by market capitalization (stock price multiplied by total shares), the growth of these seven companies to a collective 32% of the entire Index had a significant impact on overall performance. Bloomberg reports that the Magnificent 7 accounted for over half of the S&P 500’s 2024 return.
Bond investors faced additional concerns due to persistent inflation and a more aggressive stance from the Federal Reserve. Core inflation remained around 3.3% in the fourth quarter, and the Fed’s December 18 economic projections suggested only two 0.25% rate cuts in 2025. As a result, interest rates rose over the quarter, with the yield on the 10-year U.S. Treasury bond increasing from 3.79% on September 30 to 4.58% at the end of the year. The inverse relationship between yield and price led to a 3.1% decline in the Bloomberg Government/Credit Index for the quarter, reducing its total return for 2024 to 1.2%. However, in the intermediate maturity range (bonds with maturities of 3 to 10 years) where CCM has focused, performance was better, with the Bloomberg Intermediate Government/Credit Index gaining 3.0% for the year. Both indices lagged the 4%+ yields offered by ultra-safe money markets, making 2024 a frustrating year for bond investors.
ECONOMIC FORECAST: The U.S. economy is expected to grow at a more modest pace of 2.1% in 2025, down from an estimated 2.5% in 2024. While this is the consensus view, the post-Covid period has been marked by economists underestimating economic growth. We see several positives that could lead to better than consensus growth. The labor market will likely remain resilient, bolstered by solid income growth and sustained demand for skilled workers. Consumer spending, a critical driver of economic activity, is expected to remain healthy, supported by increasing real wages and a strong employment environment. Recent surveys have pointed to improving small business sentiment, which will promote capital investment and expanding employment. Technology companies are expected to spend massively on artificial intelligence (AI) build into 2025, which has many positive downstream effects. These could all lead to another surprise to the upside for the U.S.
Challenges persist, however. Inflationary pressures eased throughout most of 2024, yet we saw an uptick in October and November. Most of the acceleration continues to be concentrated in owners’ equivalent rent, a proxy for housing prices. Long-term interest rates rose over worries of higher-for-longer inflation, which could constrain both consumer spending and business investment. While we expect inflation to eventually move to the Fed’s target of 2%, risks remain over the near term. Policy uncertainty surrounding the new administration’s stance on trade, including potential tariffs, could be a headwind for reaching the Fed’s goal. Immigration reform could also upend the service economy’s reliance on low-cost labor. Successfully navigating these headwinds will help ensure sustained economic stability and promote continued growth.
FIXED INCOME STRATEGY: Corporate bonds outperformed Treasuries by 10 basis points in Q4, posting respective returns of -3.04% and -3.14%. The marginal outperformance of Corporates can be attributed to tighter spreads, as index-level spreads tightened to 0.80% from 0.89% at the end of Q3. Corporate spreads are now at their tightest levels of the past five years, and very close to all-time tights.
Amidst the backdrop of continued equity outperformance, higher interest rates, and tight credit spreads, CCM continues to favor an approach that barbells corporate bond exposure in shorter maturities (5 years or less) with U.S. Government bond exposure in the 5 to 10-year maturity range. This provides an embedded hedge against both any potential equity market weakness and reduces the effect of potential spread-widening in corporate bonds.
As we head into 2025, we continue to view the risk-reward setup for fixed income investors as constructive. While the Federal Reserve’s December “dot plot” indicates just two 0.25% interest rate cuts for 2026, we believe core inflation will continue to creep lower, and the value offered from elevated rates will prove enticing for income-seeking investors. The advantage offered by the 10-year Treasury yield over the S&P 500 dividend yield is now at its widest level since the Financial Crisis (2008). Policy decisions by the incoming administration are yet to be determined, but the setup for bonds remains compelling.
EQUITY STRATEGY: We expect more modest gains in equities over the coming year given stock market valuations. Price to earnings (P/E) multiples are at 22.1x on a 12-month forward basis versus an average of 18.1x going back to 1990. While we prefer more reasonable valuations, company profitability and fundamentals have rarely been better. S&P 500 earnings are estimated to grow by 14% in 2025, well above the trend. Profit margins are also expected to improve from 12.8% to 13.7% over last year, close to all-time highs. Additionally, debt levels are well below their historical averages. Adding to our positive outlook, AI models are in their infancy, and companies are just beginning to implement them in their processes. While the advantages will be unequal across industries, we expect many companies to benefit greatly as the AI models become more powerful and useful. Benefits will likely accrue throughout this decade as these technologies spread across the larger economy.
Market concentration continues to be a risk to performance going into 2025. Mega-cap stocks, notably the Magnificent 7, are expected to remain strong performers, yet their outsized influence may moderate, opening the door for broader market participation. Their results continue to impress, given their sheer size, but the earnings growth rate is expected to slow from 25% down to a more modest 19%. We expect consumer stocks to do well over the coming year. The strong spending trend seen last year will likely continue given the strong employment picture and growing real wages. We also expect companies that incorporate AI and other burgeoning automation technologies into their businesses will pull away from their competitors. While it is difficult to predict market action over the short run, we believe we are at the beginning of a new technological era that will drive markets to new heights. Historically, there has been a period of economic upheaval as technology regimes change, and this time will likely be no exception. We have faith that, over the long run, our capitalist system will figure out the best allocation of resources, as it has for close to 250 years.
ASSET ALLOCATION: In the sixteen years since the Financial Crisis, stocks have outperformed bonds thirteen times. The degree of separation is large, with S&P 500 stocks delivering an annual average return of 14.5%, compared to only 2.6% for Bloomberg G/C Master bonds. CCM maintained an overweight position in stocks in balanced portfolios throughout this remarkable run for the stock market.
Looking ahead, our asset allocation model continues to recommend a modest overweight in stocks. We admit that from a fundamental perspective, stock P/E multiples of around 22x do make them appear stretched. Despite this, though, the primary cause of bear markets is recessions, not valuation multiples. On that front, the economy seems to be on solid footing and corporate profits are expected to boom in 2025. If this growth materializes, today’s valuations should prove to be justified. We remain confident in the outlook for stocks and will continue to tilt balanced portfolio exposure in their favor.
Key risks to our strategic positioning include potential repercussions from a global trade war, a revolt by bond investors due to continued sky-high federal budget deficits, an uptick in inflation, and further geopolitical tensions. We are mitigating these risks by focusing on high-quality large-cap stocks and maintaining a defensive bond position. If your tolerance for these risks has changed, please feel free to contact us.
CCM Investment Advisers, LLC is a Registered Investment Adviser registered with the U.S. Securities and Exchange Commission (CRD# 105743). Any type of investing involves risk of loss and there are no guarantees that the strategies described on this website or any of the associated literature may be successful. The opinions and information contained in this report are for informational purposes only and are not meant to be predictors of future results. Such opinions and information do not constitute an offer or solicitation to provide investment advisory services. Such an offer can only be made in states where CCM Investment Advisers is registered.
Any type of investing involves risk of loss and there are no guarantees that the strategies described may be successful. Any performance data reported represents historical data and future returns may differ significantly. Past performance does not guarantee future results. CCM Investment Advisers does not assume liability for any loss which may result from the reliance by any person upon such information or opinions.
Security, index and economic information are obtained from resources which CCM believes to be accurate but no warrant is made to the accuracy or completeness of the information. Various indices described and discussed herein are unmanaged; investments cannot be made directly into an index. Indices do not incur fees that reduce performance. The performance and volatility of an index or mix of indices will not be the same as a CCM client account.
The S&P 500 Index ® is a readily available, capitalization-weighted index of 500 stocks. The index is designed to measure performance of the broad domestic economy through changes in the aggregate market value of 500 stocks representing all major industries.
The S&P 500 Growth Index ® is a stock index administered by Standard & Poor’s-Dow Jones Indices. As its name suggests, the purpose of the index is to serve as a proxy for growth companies included in the S&P 500. The index identifies growth stocks using three factors: sales growth, the ratio of earnings change to price, and momentum.
The S&P 500 Value Index ® is a stock index administered by Standard & Poor’s-Dow Jones Indices. As its name suggests, the purpose of the index is to serve as a proxy for value companies included in the S&P 500. The index identifies growth stocks using three factors: the ratios of book value, earnings, and sales to price.
Bloomberg Magnificent 7 Total Return Index is an equal-dollar weighted equity benchmark consisting of a fixed basket of 7 widely-traded companies classified in the United States.
The Barclay’s Government/Credit Index is the non-securitized component of the U.S. Aggregate Index. The index includes US Treasuries, government-related issues and corporate bonds.
The 50/50 Balanced Index is an index comprised of 50% S&P 500 stocks and 50% Barclay’s Government/Credit Index bonds.
The NASDAQ Composite Index is a readily available, capitalization-weighted index of over 2,500 domestic and international companies listed on the NASDAQ Stock Market.
All blended benchmarks are static blends.
Technical Terms:
The term federal funds rate refers to the target interest rate set by the Federal Open Market Committee (FOMC). This target is the rate at which commercial banks borrow and lend their excess reserves to each other overnight.
The Atlanta Fed GDPNow model is a real-time econometric model which forecasts GDP growth in the current quarter.
The Dividend Discount Model is a quantitative model used to predict the price of stocks based on the theory its price worth the sum of all future dividends discounted back to their present value.
The Consumer Price Index (CPI) is a measure of the monthly change in prices paid by consumers. The CPI consists of a bundle of commonly purchased goods and services. The Bureau of Labor Statistics (BLS) calculates the CPI as a weighted average of prices for a basket of goods and services representative of aggregate U.S. consumer spending.
The term duration measures how long it takes in years for an investor to be re-paid a bond’s price by the bond’s total cash flows. Duration can also measure the sensitivity of a bond’s or fixed income portfolio’s price to changes in interest rates.
The term equity risk premium refers to the excess return over bonds that investors demand to compensate for the greater risk for stocks.


