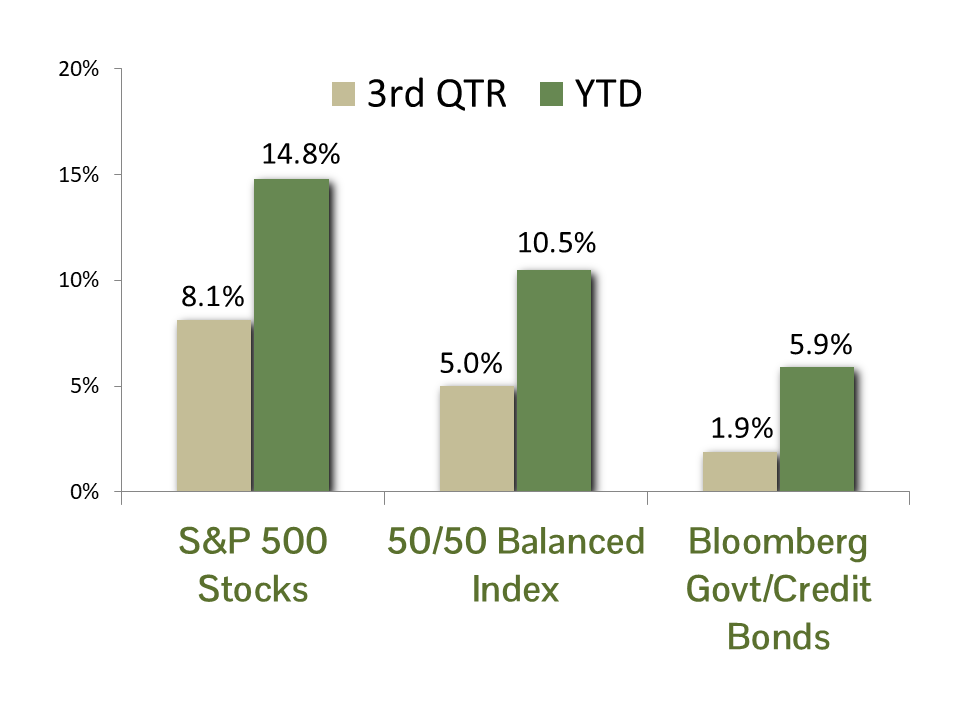
MARKET SUMMARY: The stock market ran on autopilot in the third quarter, fueled by growing enthusiasm for Artificial Intelligence (AI) stocks. The S&P 500 Index returned 8.1% for the quarter, bringing its year-to-date gain through September 30 to an impressive 14.8%.
Unsurprisingly given the fixation on AI, the Technology and Telecommunications groups led the way, each posting year-to-date returns around 25%. The “Magnificent Seven” large-cap stocks gained 19.5%. This is a bit behind their peers but is still exerting an outsized influence on the S&P 500 thanks to their collective capitalization weight of nearly one-third of the Index. On the other hand, Consumer Discretionary and Consumer Staples lagged, with gains of just 5.3% and 3.9%, respectively.
The 10-year Treasury yield began the quarter at 4.35% and fell to 4.1% by quarter-end, helped by easing inflation pressures and expectations of Fed rate cuts, including a 0.25% reduction on September 17. Falling rates boosted fixed income, with the Bloomberg Government/Credit Index rising 1.9% in the quarter and 5.9% year-to-date. This is a solid showing for a traditionally conservative asset class.
ECONOMIC FORECAST: The U.S. economy remains remarkably resilient. Growth in the second quarter was revised higher to 3.8% from 3.3% on stronger-than-estimated consumer spending. The latest Atlanta Fed GDP Now forecast for the third quarter suggests growth could come in close to 4%, well above the level many economists had expected. Recession fears spiked earlier this year when tariff disputes unsettled markets, but those odds have now dropped sharply. With consumers carrying the load and productivity improving, the economy looks strong over the next few quarters.
The job market tells a mixed story. Unemployment remains low at roughly 4.3%, and layoffs are subdued. Unemployment claims spiked in early September but have since subsided. Yet, specific industries like technology are showing stress, with payrolls shrinking and many workers struggling to find jobs that match their skills.
Inflation remains elevated at 2.9% as measured by August’s Core PCE report. Tariffs have pushed prices higher for durable goods which were previously in deflation, while housing costs, an area of high inflation since 2021, are starting to cool. Despite inflation being above the Fed’s target of 2.5%, the committee went ahead with an anticipated 25-basis-point rate cut in September. Labor market concerns were identified as the key reason for the cut.
The most important economic driver remains the consumer. Spending remains strong and has outpaced income growth over the past few months. Consumers remain concerned about prices according to survey data, yet they are likely to continue spending as long as they are employed.
FIXED INCOME STRATEGY: Corporate bonds outperformed U.S. Government bonds by 1.1% in Q3, posting returns of 2.6% and 1.5%, respectively. Corporate outperformance can be attributed to spread tightening, as the risk premium demanded for corporate bond investors narrowed to 0.74% from 0.83% at the end of Q2. However, valuations remain rich relative to their 5-year median of 1.06%.
Interest rates fluctuated over Q3, ending modestly lower. The Fed Funds futures market continues to price in two additional 0.25% rate cuts by the Federal Reserve for 2025. The FOMC’s “dot plot” supports this forecast. However, Fed Chair Powell reiterated a “meeting by meeting” approach. A slowing labor market should, on balance, favor lower interest rates. However, stubborn inflation metrics counterbalance the need for more rate cuts.
CCM continues to favor an approach that barbells corporate bond exposure in shorter maturities (5 years or less) with U.S. Government bond exposure in the 5 to 10-year maturity range. This provides an embedded hedge against both further equity market weakness and risk-manages the effect of potential spread-widening in corporate bonds. We maintained our duration target at 4.5, which is defensive versus the index, but reflects our constructive view on fixed income investments.
EQUITY STRATEGY: The Magnificent Seven stocks have been the engine behind the S&P 500’s gains since early 2016. Collectively, the stocks have contributed nearly one-third of the S&P 500’s return over that period. But leadership has bifurcated among the group based on their AI strategy execution. Nvidia, Alphabet, Meta, and Microsoft are leading with clear AI roadmaps, posting YTD gains of 22% to 38% according to Bloomberg. In contrast, Apple, Amazon, and Tesla have struggled, as doubts mount over their positioning in an AI-driven market.
Recently, a new generation of AI beneficiaries has emerged, driven by AI service companies, growing demand for cloud computing, and increased competition in semiconductor manufacturing. Broadcom’s rise to the seventh-largest U.S. company, Oracle’s 75%+ surge on AI-driven cloud demand, and Palantir’s 135% jump in 2025 on booming AI software sales highlight how the trade has broadened beyond the original group.
History shows that dominant groups eventually cede leadership. The Nifty Fifty, a group of large-cap growth stocks that investors believed could be held forever, lost their dominance in the 1970s as lofty expectations and extreme valuations collided with weaker fundamentals. AI may follow the same pattern as early enablers (semiconductors and cloud computing) give way to software platforms and then to industries using AI to transform operations. We expect this rotation to continue as AI’s evolution plays out in the coming years.
Against this backdrop, we’re maintaining meaningful exposure to the best-positioned incumbents, Nvidia, Microsoft, Meta, and Alphabet, while selectively adding emerging AI leaders in semiconductors, cloud infrastructure, and software. Our equity portfolios remain overweight quality growth, but at a reduced concentration to index weightings. By spreading exposure across both established and rising AI winners, we aim to capture the upside of this technology cycle while mitigating risk in the event of leadership rotation. This balanced approach has delivered relative strength compared to the benchmark this year and positions us for the next stage of AI-driven market leadership.
ASSET ALLOCATION: We adjusted the equity exposure in balanced accounts back to baseline earlier this year, when the CCM Equity Risk Premium model fell below its long-term average. While the model has improved recently with lower interest rates and an improving equity outlook, it is not yet giving a clear signal to increase equity exposure.
Valuations remain stretched, with prices near record highs and well above long-term norms. Our process is designed to stay disciplined in such environments, maintaining core equity exposure while making tactical adjustments where opportunities exist. For now, we continue to hold equities at baseline weightings and focus our active decisions at the individual company and sector level, where we see more favorable risk-reward tradeoffs.
Equity valuations are elevated relative to historic means and geopolitical risk remains quite high. If your risk tolerance or circumstances have changed, please contact your adviser to adjust your portfolio accordingly.
CCM Investment Advisers, LLC is a Registered Investment Adviser registered with the U.S. Securities and Exchange Commission (CRD# 105743). Any type of investing involves risk of loss and there are no guarantees that the strategies described on this website or any of the associated literature may be successful. The opinions and information contained in this report are for informational purposes only and are not meant to be predictors of future results. Such opinions and information do not constitute an offer or solicitation to provide investment advisory services. Such an offer can only be made in states where CCM Investment Advisers is registered.
Any type of investing involves risk of loss and there are no guarantees that the strategies described may be successful. Any performance data reported represents historical data and future returns may differ significantly. Past performance does not guarantee future results. CCM Investment Advisers does not assume liability for any loss which may result from the reliance by any person upon such information or opinions.
Security, index and economic information are obtained from resources which CCM believes to be accurate but no warrant is made to the accuracy or completeness of the information. Various indices described and discussed herein are unmanaged; investments cannot be made directly into an index. Indices do not incur fees that reduce performance. The performance and volatility of an index or mix of indices will not be the same as a CCM client account.
The S&P 500 Index ® is a readily available, capitalization-weighted index of 500 stocks. The index is designed to measure performance of the broad domestic economy through changes in the aggregate market value of 500 stocks representing all major industries.
The Magnificent Seven are the seven largest stocks as measured by market capitalization in the United States. The Bloomberg Magnificent 7 Total Return Index is an equal-dollar weighted equity benchmark consisting of a fixed basket of the seven largest market capitalization companies classified in the United States.
The Barclay’s Government/Credit Index is the non-securitized component of the U.S. Aggregate Index. The index includes US Treasuries, government-related issues and corporate bonds.
Corporate bonds returns and U.S. Government bond returns reference the Bloomberg U.S. Corporate Total Return Index and Bloomberg U.S. Government Total Return Index, respectively.
The 50/50 Balanced Index is an index comprised of 50% S&P 500 stocks and 50% Barclay’s Government/Credit Index bonds.
The NASDAQ Composite Index is a readily available, capitalization-weighted index of over 2,500 domestic and international companies listed on the NASDAQ Stock Market.
Equity index valuation and earnings statistics are calculated using the Bloomberg Professional Service unless otherwise indicated.
All blended benchmarks are static blends.
Technical Terms:
The term federal funds rate refers to the target interest rate set by the Federal Open Market Committee (FOMC). This target is the rate at which commercial banks borrow and lend their excess reserves to each other overnight.
The Atlanta Fed GDPNow model is a real-time econometric model which forecasts GDP growth in the current quarter.
The Dividend Discount Model is a quantitative model used to predict the price of stocks based on the theory its price worth the sum of all future dividends discounted back to their present value.
The Consumer Price Index (CPI) is a measure of the monthly change in prices paid by consumers. The CPI consists of a bundle of commonly purchased goods and services. The Bureau of Labor Statistics (BLS) calculates the CPI as a weighted average of prices for a basket of goods and services representative of aggregate U.S. consumer spending.
The Producer Price Index (PPI) is a measure of inflation at the wholesale level. It’s compiled from thousands of indexes that measure producer prices by industry and product category and is published monthly by the U. S. Bureau of Labor Statistics (BLS)
The term duration measures how long it takes in years for an investor to be re-paid a bond’s price by the bond’s total cash flows. Duration can also measure the sensitivity of a bond’s or fixed income portfolio’s price to changes in interest rates.
The term equity risk premium refers to the excess return over bonds that investors demand to compensate for the greater risk for stocks.
The ISM Manufacturing index, also known as the purchasing managers’ index (PMI), is a monthly indicator of U.S. economic activity based on a survey of purchasing managers at manufacturing firms nationwide The ISM Services index is based on surveys sent to purchasing and supply companies of more than 400 services firms. Both are considered to be key indicators of the state of the U.S. economy.