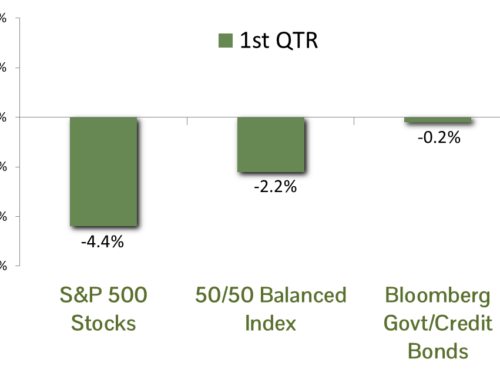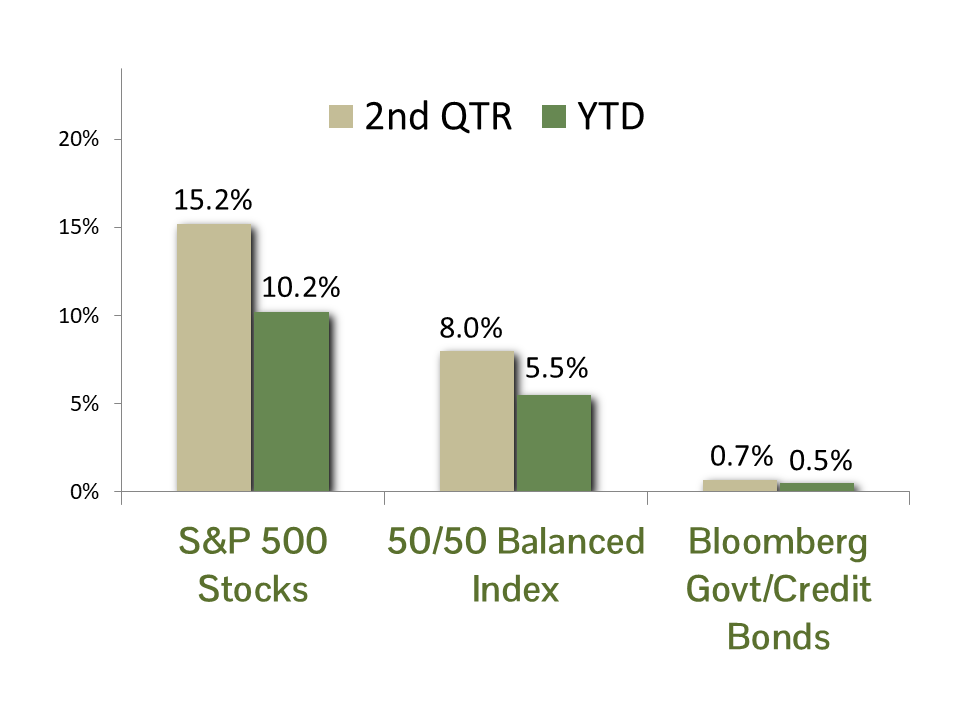
MARKET SUMMARY: The second quarter of 2026 was a dramatic and historic one for financial markets, highlighted by powerful sector rallies, macroeconomic shifts and SpaceX’s massive IPO. As measured by the S&P 500 index, stocks gained 15.2% in the quarter. It was their best quarterly performance in over six years, reversing their Q1 loss and bringing the total return through 6/30/26 to a healthy 10.2%.
The large-cap technology shares known collectively as the Magnificent 7 continued to underperform in the second quarter, largely due to valuation concerns. The group has declined 1.7% for the year, leading many to refer to the group as the “Lag 7”. As diversified stock investors who avoid oversized positions in individual securities, their underperformance has worked to our benefit. However, the biggest factor explaining our stock picking success has been in our semiconductor selections. Apologies to SpaceX, but semiconductor shares have been the real moonshot this year. The benchmark PHLX Semiconductor index (aka the “SOX”) has been in a vertical ascent, rising a staggering 101.7% in the first half.
Although there has been intense investor angst regarding inflation, as well as much speculation about the path for the Federal Reserve under new Chair Kevin Warsh, bond yields have remained in a rather tight band of 4 to 4.6% for the 10-year Treasury bond this year. Thankfully, the tenuous cessation of hostilities in Iran has led to a pronounced decline in oil prices, relieving worst-case inflation fears and placing a bit of a cap on interest rates. In the end, the benchmark Bloomberg Gov’t/Credit bond index returned 0.7% in the second quarter. After a rewarding 6.9% year in 2025, bonds have disappointed investors this year, posting a total return of only 0.5%.
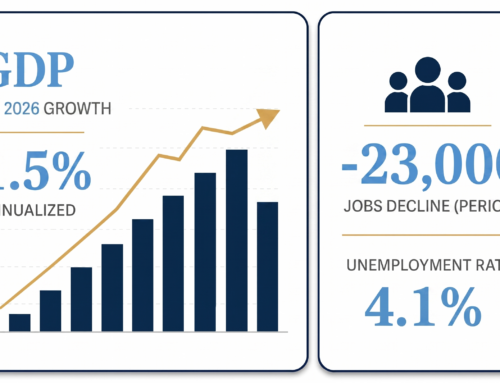
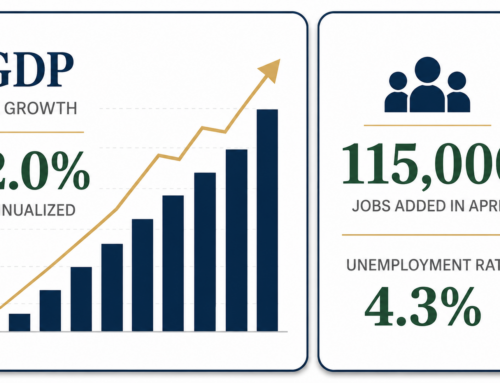
ECONOMIC FORECAST: U.S. economic prospects began the second quarter on strong footing, with robust employment growth and business output. Initial GDP growth estimates for the Atlanta Fed’s GDP Now model were 3.7%. However, the war with Iran changed the picture significantly by driving up oil prices, crimping growth during the quarter, and reducing current GDP estimates to a mere 1.2%.
The surge in oil prices drove annual PCE, the Fed’s preferred inflation measure, from 2.9% in February to 4.1% in May. This sharp increase put the Fed on high alert for rate hikes, which could have further crimped growth. Rate increases seem to be off the table for now, after a steep drop in oil prices and a lower monthly inflation print in May’s report. Assuming no further surprises or policy mistakes, we expect growth to reaccelerate over the remainder of the year.
Despite higher inflation during the quarter, consumer spending remained surprisingly strong. Baby Boomers – many of whose retirement savings have increased significantly from 10 years of strong stock market returns – are spending more on travel, healthcare, leisure, and other service-oriented areas of the economy. At the same time, a healthy labor market with steady job creation and limited layoffs continues to support broader consumer confidence. While a sharp decline in asset prices could weigh on spending through a negative wealth effect, current conditions suggest the consumer remains on solid footing, supporting our view that the economy will continue to grow.
FIXED INCOME STRATEGY: After a bumpy start in Q1, bonds found some footing in the 2nd quarter. With the spike in oil prices flowing through to inflationary measures, the front-end of the yield curve saw rates move higher as the market braced for a potential rate hike by the Federal Reserve. However, the “belly” of the curve fared better, with 7 and 10-year yields rising less significantly. Corporate bonds meaningfully outperformed U.S. Treasury bonds by 1.08% in Q2, posting returns of 1.40% and 0.32%, respectively, at the broad index level. Credit spreads on corporate bonds remained supportive, with spreads tightening 15 basis points at the index level.
The FOMC policy path from here remains uncertain. The new Fed Chairman, Kevin Warsh, used his first press conference in June to strike a balanced tone and temper expectations towards future policy adjustments. Additionally, Chair Warsh also favors a Fed that provides less forward guidance than his predecessors. This makes the already tricky task of forecasting rates even more challenging.
CCM continues to favor an approach that barbells corporate bond exposure in shorter maturities (5 years or less) with U.S. Government bond exposure in the 5 to 10-year maturity range. This provides an embedded hedge against potential equity market weakness and risk-manages the effect of potential spread-widening in corporate bonds, which remain richly valued compared to historical metrics. We modestly increased our duration target to 5.0 in Q1, which is defensive versus the index (6.12), and expect to maintain this target in the latter half of 2026.
EQUITY STRATEGY: The equity market continues to be heavily influenced by artificial intelligence, but the story is becoming more balanced. Bloomberg Intelligence estimates that 44 AI-linked companies now represent roughly 45% of the S&P 500’s market capitalization and are expected to contribute more than 60% of the index’s earnings growth in 2026. That concentration level is worrisome, but it is also supported to date by unusually strong fundamentals. Semiconductors and hyperscalers are seeing revenue and earnings growth, as well as margin expansion, well above the broader market. The risk is that the scale of capital spending required to build out AI infrastructure will begin to pressure AI companies’ free cash flow. The best opportunities are likely to come from companies that can translate AI investment into long-term operating advantages. Improving earnings growth outside the AI complex could broaden market leadership and reduce the index’s reliance on a narrow group of mega-cap stocks, providing a healthier foundation for continued equity gains in the second half of the year.
We are pleased with our equity model’s performance throughout the AI transition. As an example – we added Nvidia to the portfolio during the 2022 market selloff and prior to OpenAI’s release of ChatGPT onto the world – but strived to remain disciplined with respect to our position-sizing and thematic exposures relative to the broader index. The outperformance of our model through the first half of 2026 has been highlighted in part by stock selections in the following AI-subsectors and themes:
- Semiconductors: Demand for semiconductors has been insatiable, as they are needed at every stage of the AI stack. We increased exposure to capitalize on this trend.
- Storage: AI models need lots of memory to train and deliver models to consumers and businesses. Supply-demand imbalances have driven up memory prices and delivered stellar returns to shareholders this year.
- Power: AI requires significant power to run data centers. We have exposure through utilities, power equipment, and power management stocks.
These are but a few examples of positive trends that have driven the returns in client portfolios year to date. Our underweight to “Mag 7” stocks, a risk we have been writing about for years, is paying off as their shares have come under pressure. We have also largely avoided the sell-off in software companies, which have been a casualty of the AI trend. The landscape will continue to evolve as AI becomes more integrated into the economy. We will continue to focus on identifying sectors and companies positioned to benefit from AI adoption.
ASSET ALLOCATION: Our equity risk premium model rose to its highest level since our study began in 1973. In isolation, this would typically signal a full overweight to equities in balanced portfolios. While we did increase equity exposure during the quarter, we are applying judgment rather than blindly following the model.
A key input in our model is long-term earnings growth, and current growth estimates are nearly two standard deviations above their historical average. We view that assumption as aggressive given the current stage of the earnings cycle. Therefore, while the model supports a more constructive view on equities, we believe it may be overstating expected returns. Accordingly, we are positioning portfolios with a less aggressive asset mix than the model suggests.
Key investment risks include elevated equity valuations, overinvestment in the AI buildout, political upheaval, and a credit crisis in private debt. If your risk tolerance or circumstances have changed, please contact your adviser to adjust your investment policy accordingly.
CCM Investment Advisers, LLC is a Registered Investment Adviser registered with the U.S. Securities and Exchange Commission (CRD# 105743). Any type of investing involves risk of loss and there are no guarantees that the strategies described on this website or any of the associated literature may be successful. The opinions and information contained in this report are for informational purposes only and are not meant to be predictors of future results. Such opinions and information do not constitute an offer or solicitation to provide investment advisory services. Such an offer can only be made in states where CCM Investment Advisers is registered.
Any type of investing involves risk of loss and there are no guarantees that the strategies described may be successful. Any performance data reported represents historical data and future returns may differ significantly. Past performance does not guarantee future results. CCM Investment Advisers does not assume liability for any loss which may result from the reliance by any person upon such information or opinions.
Security, index and economic information are obtained from resources which CCM believes to be accurate but no warrant is made to the accuracy or completeness of the information. Various indices described and discussed herein are unmanaged; investments cannot be made directly into an index. Indices do not incur fees that reduce performance. The performance and volatility of an index or mix of indices will not be the same as a CCM client account.
The S&P 500 Index ® is a readily available, capitalization-weighted index of 500 stocks. The index is designed to measure performance of the broad domestic economy through changes in the aggregate market value of 500 stocks representing all major industries.
The Magnificent Seven are the seven largest stocks as measured by market capitalization in the United States. The Bloomberg Magnificent 7 Total Return Index is an equal-dollar weighted equity benchmark consisting of a fixed basket of the seven largest market capitalization companies classified in the United States.
The Barclay’s Government/Credit Index is the non-securitized component of the U.S. Aggregate Index. The index includes US Treasuries, government-related issues and corporate bonds.
The 50/50 Balanced Index is an index comprised of 50% S&P 500 stocks and 50% Barclay’s Government/Credit Index bonds.
The NASDAQ Composite Index is a readily available, capitalization-weighted index of over 2,500 domestic and international companies listed on the NASDAQ Stock Market.
The PHLX Semiconductor Sector (SOX) is a capitalization-weighted index comprising the 30 largest U.S.-traded companies primarily involved in the design, distribution, manufacture, and sale of semiconductors.
Equity index valuation and earnings statistics are calculated using the Bloomberg Professional Service unless otherwise indicated.
All blended benchmarks are static blends.
Technical Terms:
The term federal funds rate refers to the target interest rate set by the Federal Open Market Committee (FOMC). This target is the rate at which commercial banks borrow and lend their excess reserves to each other overnight.
The Atlanta Fed GDPNow model is a real-time econometric model which forecasts GDP growth in the current quarter.
The Consumer Price Index (CPI) is a measure of the monthly change in prices paid by consumers. The CPI consists of a bundle of commonly purchased goods and services. The Bureau of Labor Statistics (BLS) calculates the CPI as a weighted average of prices for a basket of goods and services representative of aggregate U.S. consumer spending.
The Producer Price Index (PPI) is a measure of inflation at the wholesale level. It’s compiled from thousands of indexes that measure producer prices by industry and product category and is published monthly by the U. S. Bureau of Labor Statistics (BLS)
The term duration measures how long it takes in years for an investor to be re-paid a bond’s price by the bond’s total cash flows. Duration can also measure the sensitivity of a bond’s or fixed income portfolio’s price to changes in interest rates.
The term equity risk premium refers to the excess return over bonds that investors demand to compensate for the greater risk for stocks.
The ISM Manufacturing index, also known as the purchasing managers’ index (PMI), is a monthly indicator of U.S. economic activity based on a survey of purchasing managers at manufacturing firms nationwide The ISM Services index is based on surveys sent to purchasing and supply companies of more than 400 services firms. Both are considered to be key indicators of the state of the U.S. economy.