MARKET SUMMARY: Stocks began the second quarter with continued declines, culminating in a sharp selloff following the April 2 “Liberation Day” announcement of broad-based tariffs on most major trading partners. This pushed the market to within one percent of the 20% decline typically used to define a bear market.
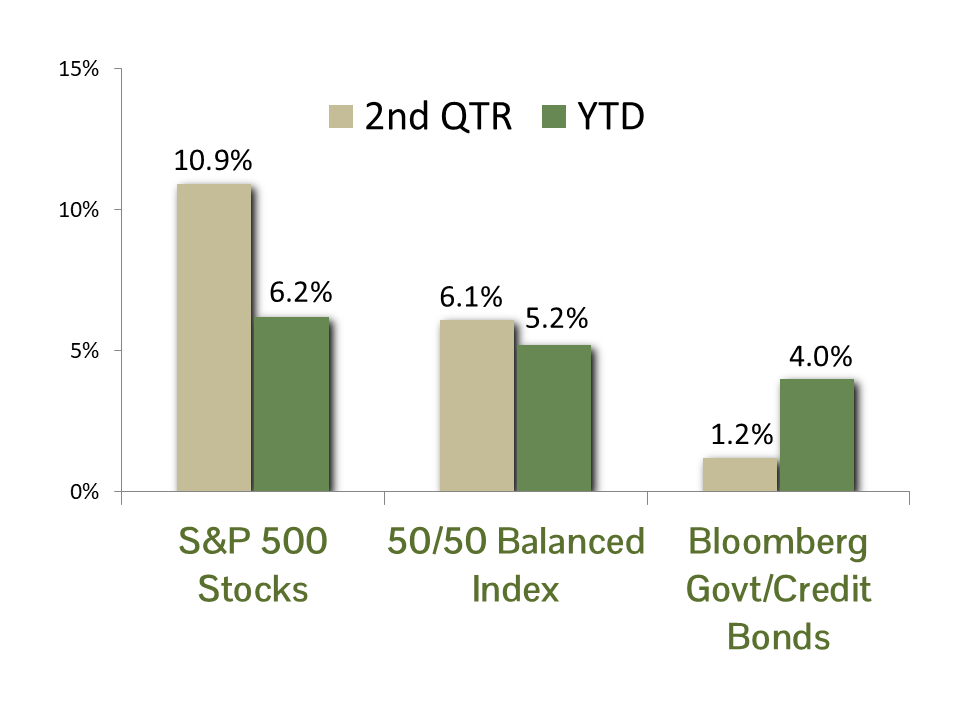
However, a temporary reprieve on tariffs until July 9 (along with expectations of further delays) combined with resilient economic data, cooling inflation, and a ceasefire between Israel and Iran, sparked a strong market rebound. Stocks gained 10.9% in the second quarter, closing at a record high. This reversed earlier losses and lifted the year-to-date return through June 30 to a solid 6.2%.
In a notable shift, the mega-cap “Magnificent 7” tech stocks are not the leaders of the 2025 rally. Weak performances from Amazon, Tesla, Apple, and Alphabet offset strong gains from AI leaders Microsoft, Nvidia, and Meta. As measured by the Bloomberg Magnificent 7 Total Return Index, the group has returned 1.7% for the year. Surprisingly, given the uncertain economic backdrop, the top-performing sector for the year is Industrials, rising 12.7%.
The bond market in Q2 was shaped by ongoing signs of easing inflation and growing expectations of Federal Reserve rate cuts. The 10-year Treasury yield ranged from a low of 4.0% on April 4 to a high of 4.6% on May 21, ending the quarter at 4.2% – virtually unchanged from the end of Q1. As a result, bonds delivered modest “coupon” returns in the second quarter. The Bloomberg Government/Credit Bond Index rose 1.2% for the quarter, bringing its year-to-date return to a generous 4.0%.
ECONOMIC FORECAST: The U.S. economic picture has been muddied by consumer and business responses to U.S. trade policy uncertainty. First quarter GDP fell 0.5% as import orders surged ahead of impending tariffs (imports are netted out of GDP). The latest Atlanta GDP Now model predicts second-quarter growth of 2.9%, driven by consumer purchases of automobiles and other big-ticket items. The front-loading purchasing behavior could all be for naught as the Trump administration has announced pending trade deals with several countries. Policy uncertainty is expressed through the latest consumer confidence survey as published by the Confidence Board, which fell to 93, a level not seen since early 2021. Consumers are concerned about high prices and weakening job prospects. A beleaguered consumer is even more concerning given an otherwise positive backdrop of falling gasoline prices, and close to full employment — both of which tend to boost consumer sentiment. It is difficult to discern the signal in all the noise, but we are expecting a clearer sense of the path ahead as we move into the second half of the year.
Inflation has fallen markedly this year at both the consumer and producer levels. Consumer prices, as measured by CPI, dropped from 3% in January to 2.35% on a year-over-year basis in the latest report. Producer prices, as measured by PPI, have fallen even more dramatically from 3.8% in January to 2.6% on an annual basis. This trend of falling prices runs counter to the prices paid measures in the latest PMI reports, which are well ahead of where they were last year. The Federal Reserve has expressed concern about a possible reacceleration of inflation in the back half of the year. We are taking a wait-and-see approach to see how tariffs will affect pricing over the coming months. Our baseline assumption is that prices will continue to moderate; however, caution is warranted given the numerous moving pieces in play.
FIXED INCOME STRATEGY: Corporate bonds outperformed U.S. Government bonds by 0.97% in Q2, posting returns of 1.82% and 0.85%, respectively. Corporate outperformance can be attributed to spread tightening, as the average corporate spread over Treasuries narrowed to 0.83% from 0.94% at the end of Q1. However, valuations remain rich relative to their 5-year median of 1.09%.
Interest rates fluctuated over Q2, only to effectively end unchanged. Fed Funds futures continue to price in two cuts by the Federal Reserve for 2025, despite the FOMC seemingly content to maintain the policy rate at its current level. A slowing labor market should, on balance, favor lower interest rates. However, the implied budgetary consequences of the “Big Beautiful Bill” may counterbalance labor concerns and keep upward pressure on rates.
CCM continues to favor an approach that barbells corporate bond exposure in shorter maturities (5 years or less) with U.S. Government bond exposure in the 5 to 10-year maturity range. This provides an embedded hedge against both further equity market weakness and risk-manages the effect of potential spread-widening in corporate bonds. We maintained our duration target at 4.5, which is defensive versus the index, but reflects our constructive view on fixed income investments.
EQUITY STRATEGY: Although still laggards for the year, the Magnificent Seven stocks rebounded sharply in the second quarter, erasing their 16% loss sustained in the first quarter. Apple was the lone laggard during the second quarter, with shares declining as the company is increasingly seen as trailing its peers in the Artificial Intelligence race. The debate continues among technologists and futurists as to whether AI will prove to be a sweeping, transformational force on par with the internet or a more incremental shift limited by today’s model constraints. Judging by the record levels of capital flowing into nearly every company associated with AI, the market appears to be placing a strong bet on the former. We continue to evaluate how AI adoption can enhance the companies we invest in, both through new product development and meaningful gains in operational efficiency. We believe AI will remain a dominant theme shaping market leadership and return potential through the remainder of the decade.
The earnings environment for equities remains supportive. After surging during the post-COVID recovery, earnings growth moderated in 2023 and 2024. Analysts project earnings to grow 11% annually over the next three years, well above the long-term average of 8.0%. While this outlook is encouraging, it assumes that the aggressive investment in AI infrastructure will continue uninterrupted over the coming years. Additionally, the S&P 500 is trading at a 22.1x price/earnings ratio on a 12-month blended forward earnings basis, which is roughly 35% above its long-term average . Outsized expectations in an expensive market is a movie we have seen before. While there is much room for optimism, we advocate for caution before making further bets in the most speculative parts of the market.
ASSET ALLOCATION: We reduced equity exposure back to baseline in balanced accounts during the first quarter as the CCM Equity Risk Premium model fell below its long-term average. This call proved to be the right call outside of the last few weeks as equity markets surged. A combination of easing tensions in the Middle East, cooler inflation readings, and softer employment data raised expectations for Federal Reserve rate cuts, providing a tailwind for equity markets. While a lower interest rate environment would tilt the model toward increased equity exposure, we remain cautious at the index level, as prices are trading near all-time highs and are well above typical valuation metrics. We continually monitor our model for changes and will adjust exposure when prudent. In short, we are maintaining our baseline allocation to equity exposure while continuing to make tactical bets at the individual company and sector levels.
There remains significant economic, fiscal, and geopolitical uncertainty, any of which could derail the rally seen in the second quarter. If your risk tolerance or circumstances have changed, please get in touch with your adviser to adjust your portfolio accordingly.
CCM Investment Advisers, LLC is a Registered Investment Adviser registered with the U.S. Securities and Exchange Commission (CRD# 105743). Any type of investing involves risk of loss and there are no guarantees that the strategies described on this website or any of the associated literature may be successful. The opinions and information contained in this report are for informational purposes only and are not meant to be predictors of future results. Such opinions and information do not constitute an offer or solicitation to provide investment advisory services. Such an offer can only be made in states where CCM Investment Advisers is registered.
Any type of investing involves risk of loss and there are no guarantees that the strategies described may be successful. Any performance data reported represents historical data and future returns may differ significantly. Past performance does not guarantee future results. CCM Investment Advisers does not assume liability for any loss which may result from the reliance by any person upon such information or opinions.
Security, index and economic information are obtained from resources which CCM believes to be accurate but no warrant is made to the accuracy or completeness of the information. Various indices described and discussed herein are unmanaged; investments cannot be made directly into an index. Indices do not incur fees that reduce performance. The performance and volatility of an index or mix of indices will not be the same as a CCM client account.
The S&P 500 Index ® is a readily available, capitalization-weighted index of 500 stocks. The index is designed to measure performance of the broad domestic economy through changes in the aggregate market value of 500 stocks representing all major industries.
Bloomberg Magnificent 7 Total Return Index is an equal-dollar weighted equity benchmark consisting of a fixed basket of 7 widely-traded companies classified in the United States.
The Barclay’s Government/Credit Index is the non-securitized component of the U.S. Aggregate Index. The index includes US Treasuries, government-related issues and corporate bonds.
Corporate bonds returns and U.S. Government bond returns reference the Bloomberg U.S. Corporate Total Return Index and Bloomberg U.S. Government Total Return Index, respectively.
The 50/50 Balanced Index is an index comprised of 50% S&P 500 stocks and 50% Barclay’s Government/Credit Index bonds.
The NASDAQ Composite Index is a readily available, capitalization-weighted index of over 2,500 domestic and international companies listed on the NASDAQ Stock Market.
Equity index valuation and earnings statistics are calculated using the Bloomberg Professional Service unless otherwise indicated.
All blended benchmarks are static blends.
Technical Terms:
The term federal funds rate refers to the target interest rate set by the Federal Open Market Committee (FOMC). This target is the rate at which commercial banks borrow and lend their excess reserves to each other overnight.
The Atlanta Fed GDPNow model is a real-time econometric model which forecasts GDP growth in the current quarter.
The Dividend Discount Model is a quantitative model used to predict the price of stocks based on the theory its price worth the sum of all future dividends discounted back to their present value.
The Consumer Price Index (CPI) is a measure of the monthly change in prices paid by consumers. The CPI consists of a bundle of commonly purchased goods and services. The Bureau of Labor Statistics (BLS) calculates the CPI as a weighted average of prices for a basket of goods and services representative of aggregate U.S. consumer spending.
The Producer Price Index (PPI) is a measure of inflation at the wholesale level. It’s compiled from thousands of indexes that measure producer prices by industry and product category and is published monthly by the U. S. Bureau of Labor Statistics (BLS)
The term duration measures how long it takes in years for an investor to be re-paid a bond’s price by the bond’s total cash flows. Duration can also measure the sensitivity of a bond’s or fixed income portfolio’s price to changes in interest rates.
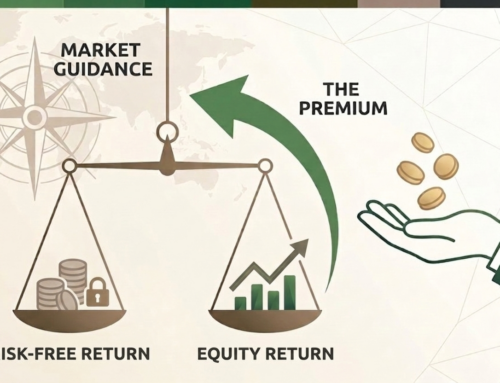
The term equity risk premium refers to the excess return over bonds that investors demand to compensate for the greater risk for stocks.
The ISM Manufacturing index, also known as the purchasing managers’ index (PMI), is a monthly indicator of U.S. economic activity based on a survey of purchasing managers at manufacturing firms nationwide The ISM Services index is based on surveys sent to purchasing and supply companies of more than 400 services firms. Both are considered to be key indicators of the state of the U.S. economy.