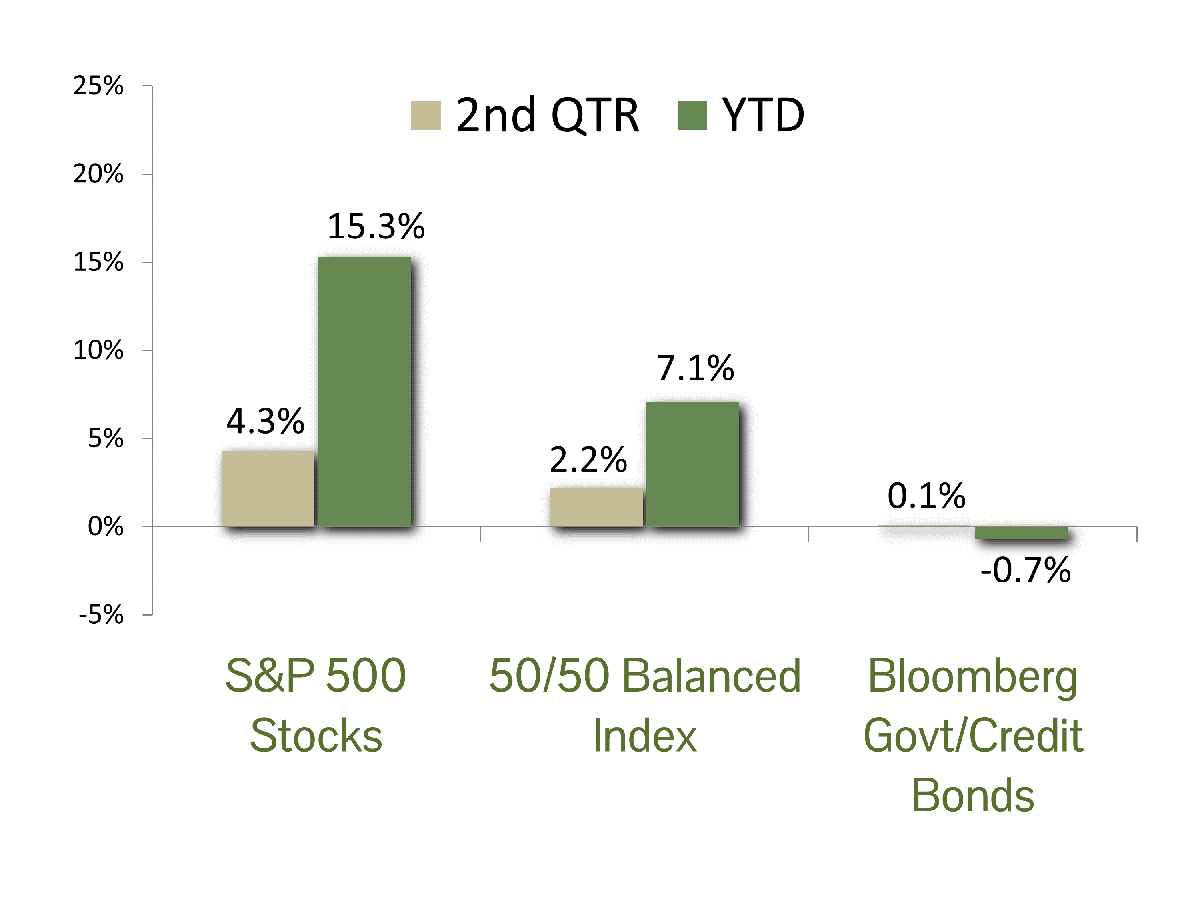
MARKET SUMMARY: The benchmark S&P 500 index gained 4.3% in the second quarter, buoyed by continued economic strength and the possibility of one or two Fed rate cuts in the second half of the year. Combined with the first quarter’s 10.6% gain, the index has posted a solid 15.3% total return for the year-to-date through June 30, 2024.
Although the stock market’s 2024 gain is impressive, performance is again highly concentrated in large-cap technology shares. The ongoing Artificial Intelligence frenzy has skewed performance towards the “Magnificent Seven” stocks: Microsoft, Apple, Alphabet, Amazon, NVIDIA, Tesla, and Meta. This group has gained a remarkable 50%-plus in market capitalization this year and now comprises over 30% of the entire S&P 500 index. NVIDIA remains the star attraction, overtaking Microsoft and Apple on June 18 to become the most valuable U.S. stock. However, the reign was brief, as the shares pulled back by more than 10% over the next three days, a move technically defined as a “correction.” NVIDIA has still gained over 150% for the year.
At the start of the quarter persistent inflation reduced investors’ expectations of the number of Fed interest rate cuts this year. Consequently, bond yields increased significantly, with the yield on the 10-Year Treasury bond rising from 4.2% at the start of the quarter to 4.7% in less than a month. As expectations shifted to one or perhaps two rate cuts this year, yields then declined sharply, ending the quarter within two-tenths of a percentage point from where they began. The virtual round trip in interest rates resulted in essentially flat performance for the bond market. As measured by the benchmark Bloomberg Government/Credit index, bonds gained 0.1% for the quarter. Their loss for the year stands at -0.7%.
ECONOMIC FORECAST: Recent economic data suggests that the Federal Reserve’s interest rate policy is beginning to impact economic growth. The latest ISM services data indicated a contraction in the sector that has driven most of the growth this year. The labor market, while still supportive, is beginning to show signs of strain. June’s employment report showed 206,000 jobs added with large downward revisions to previous months. Moreover, the recent upward trend in weekly jobless claims reflects more workers seeking unemployment benefits. The latest estimate from the Atlanta Fed GDP Now model predicts an anemic 1.5% growth in the second quarter, a significant drop from the initial 3.9%.
Inflation and, by extension, affordability have been primary concerns for consumers and investors for more than two years. Consumer spending, which has been resilient despite rising prices, has shown signs of slowing in the past two months, indicating consumer fatigue from prolonged high prices. The past few months’ data shows improvement in inflation statistics with many components experiencing outright deflation. Remaining inflation is largely concentrated in housing and auto insurance, both of which are improving.
While we are not in recession territory, the signs point to a period of slower growth. Conditions seem primed for the Fed to consider rate cuts in the coming months, setting the stage for a robust 2025 and providing a boost to risk assets.
FIXED INCOME STRATEGY: The second quarter saw a modest reversal of the trend witnessed in Q1 where corporate bonds outperform U.S. Government bonds (Treasuries & Agencies). Credit spreads on corporate bonds tightened in April and May. However, the trend reversed in June and finished the quarter with spreads 4 basis points wider (albeit still tight by historical standards).
The timing of our duration extension (i.e., lengthening the average maturity of bond portfolios) has proved fortuitous. Additionally, we have favored expressing our corporate credit exposure in shorter maturities, while adding duration through Government bonds in longer securities. This was additive on the quarter as credit spreads widened modestly. Furthermore, this provides an embedded hedge should equity markets experience any weakness, which typically results in corporate spreads moving wider as a result.
As we head into the latter half of 2024, we continue to view the risk-reward for fixed income as increasingly constructive. Inflation metrics have started to cooperate (trending lower). And while the battle is not yet won, the data continues to suggest that the next move by the Fed will be an interest rate cut. We maintain conviction in our positioning and will continue to monitor portfolios for incremental and opportunistic adjustments.
EQUITY STRATEGY: The Magnificent Seven stocks continue to dominate index-level returns. Notably, only Nvidia ranks in the top 10 year-to-date performance of the S&P 500. Investors currently are favoring companies with strong balance sheets due to higher interest expenses affecting debt-reliant firms. Market breadth has improved significantly compared to last year, with more companies contributing to index performance. Concentration risk is still present, as nearly one-third of the S&P 500’s market capitalization is held by only seven companies. However, the increased participation is encouraging. Our strategy involves holding positions in these high-growth names but underweighting them relative to the index. While this approach may result in lower short-term returns, historical trends indicate that market euphoria eventually subsides, leading to significant drawdowns.
Several tailwinds should support equity prices over the coming years. The government infrastructure bill, grid electrification, manufacturing onshoring, and an AI investment boom are all boosting investor enthusiasm for stocks. While we would prefer to see a smooth upward trend in stock prices, we expect volatility to increase from current lows. Current political uncertainty, record government deficits, and an expiring tax bill could all trigger market volatility. Markets prefer certainty, and the current environment is anything but. Any sell-off should be an opportunity to add exposure, as the investment environment remains supportive of risk assets.
ASSET ALLOCATION: Based on our internal research, the expected return spread between stocks and bonds lies just above its historic average, giving no firm indication of a valuation imbalance between the two asset classes. Investor psychology is a bit weak, as there is a cognitive disconnect between gloomy investor perceptions and reality. Actually, the current economic and financial situation is quite robust. The economy is growing around 2%, inflation is falling towards the Fed’s target, unemployment is near a 30-year low, and the stock market continues to set record highs with few signs of a “bubble” such as the one preceding the Tech Wreck of 2000. With such a positive fundamental backdrop we are maintaining a modest overweight in equities in balanced portfolios.
As always, investing involves risk. This includes potential challenges from a messy election season (both in the U.S. and globally), a heated geopolitical situation, a growing U.S. budget deficit, the possibility of an inflation rebound, and an unexpected economic downturn. We remain aware of these risks and mitigate them by focusing on high-quality large-cap stocks and maintaining a defensive bond position. If your tolerance for such risks or any other circumstances have changed, please feel free to contact us.
CCM Investment Advisers, LLC is a Registered Investment Adviser registered with the U.S. Securities and Exchange Commission (CRD# 105743). Any type of investing involves risk of loss and there are no guarantees that the strategies described on this website or any of the associated literature may be successful. The opinions and information contained in this report are for informational purposes only and are not meant to be predictors of future results. Such opinions and information do not constitute an offer or solicitation to provide investment advisory services. Such an offer can only be made in states where CCM Investment Advisers is registered.
Any type of investing involves risk of loss and there are no guarantees that the strategies described may be successful. Any performance data reported represents historical data and future returns may differ significantly. Past performance does not guarantee future results. CCM Investment Advisers does not assume liability for any loss which may result from the reliance by any person upon such information or opinions.
Security, index and economic information are obtained from resources which CCM believes to be accurate but no warrant is made to the accuracy or completeness of the information. Various indices described and discussed herein are unmanaged; investments cannot be made directly into an index. Indices do not incur fees that reduce performance. The performance and volatility of an index or mix of indices will not be the same as a CCM client account.
The S&P 500 Index ® is a readily available, capitalization-weighted index of 500 stocks. The index is designed to measure performance of the broad domestic economy through changes in the aggregate market value of 500 stocks representing all major industries.
The S&P 500 Growth Index ® is a stock index administered by Standard & Poor’s-Dow Jones Indices. As its name suggests, the purpose of the index is to serve as a proxy for growth companies included in the S&P 500. The index identifies growth stocks using three factors: sales growth, the ratio of earnings change to price, and momentum.
The S&P 500 Value Index ® is a stock index administered by Standard & Poor’s-Dow Jones Indices. As its name suggests, the purpose of the index is to serve as a proxy for value companies included in the S&P 500. The index identifies growth stocks using three factors: the ratios of book value, earnings, and sales to price.
The Barclay’s Government/Credit Index is the non-securitized component of the U.S. Aggregate Index. The index includes US Treasuries, government-related issues and corporate bonds.
The 50/50 Balanced Index is an index comprised of 50% S&P 500 stocks and 50% Barclay’s Government/Credit Index bonds.
The NASDAQ Composite Index is a readily available, capitalization-weighted index of over 2,500 domestic and international companies listed on the NASDAQ Stock Market.
All blended benchmarks are static blends.
Technical Terms:
The term federal funds rate refers to the target interest rate set by the Federal Open Market Committee (FOMC). This target is the rate at which commercial banks borrow and lend their excess reserves to each other overnight.
The Atlanta Fed GDPNow model is a real-time econometric model which forecasts GDP growth in the current quarter.
The Consumer Price Index (CPI) is a measure of the monthly change in prices paid by consumers. The CPI consists of a bundle of commonly purchased goods and services. The Bureau of Labor Statistics (BLS) calculates the CPI as a weighted average of prices for a basket of goods and services representative of aggregate U.S. consumer spending.
The term duration measures how long it takes, in years, for an investor to be repaid a bond’s price by the bond’s total cash flows. Duration can also measure the sensitivity of a bond’s or fixed income portfolio’s price to changes in interest rates.
The term equity risk premium refers to the excess return over bonds that investors demand to compensate for the greater risk for stocks.
ISM refers to the Institute for Supply Chain Management. The ISM Services Data refers to a measurement of economic activity within the services sector of the economy.