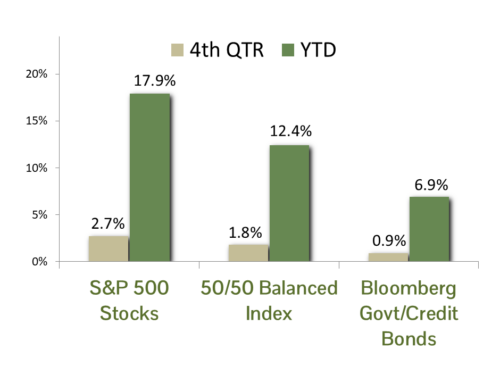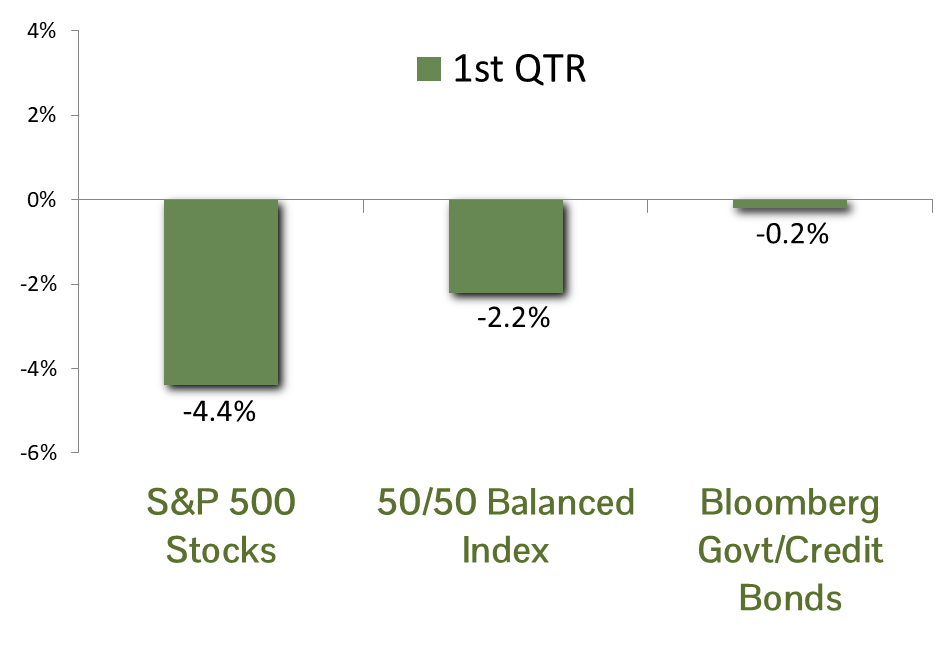
MARKET SUMMARY: The first quarter of 2026 was defined by a sharp pivot from optimism to geopolitical volatility, as investors grappled with the war in Iran. Volatility was very high across most markets, with the direction hinging on the latest (and often contradictory) indications of an end to the hostilities. Oil prices skyrocketed, with West Texas crude oil rising from a $58 per barrel quarterly low to $100 by quarter’s end. This propelled energy stocks to a 38.3% gain.
Defensive sectors such as consumer staples and utilities also posted strong gains during the quarter. The market’s few winners could not offset the broader losses though – particularly for large-cap technology shares. The Bloomberg Magnificent Seven index declined 12% in the quarter. Those seven companies comprise roughly 30% of the entire S&P 500 index and drove the index to a loss of 4.4%.
In the U.S. bond market, the “higher-for-longer” interest rate reality was cemented by the spike in commodity-driven inflation due to the Iran war. The market is now pricing in no Federal Reserve interest rate cuts for the year. Interest rates rose during the quarter, but perhaps due to a “flight to quality” the increase was slight. In the end the benchmark Bloomberg Government/Credit Master index declined 0.2% for the quarter.
ECONOMIC FORECAST: The conflict with Iran has introduced a new layer of uncertainty to the near-term outlook for the U.S. economy. Since the pandemic, consumer spending has been a key driver of growth, and a sustained rise in fuel prices would impose a tax on households, leaving less room for discretionary spending and increasing the risk of recession. We do not pretend to be able to forecast the outcome of complex geopolitical events but instead look to market pricing for clues. At present, energy futures suggest investors expect the current hostilities to be resolved relatively quickly, with oil prices moving back toward pre-conflict levels by early 2027. Time will tell whether that expectation proves correct.
An energy-driven recession is not our base case, but the economy was showing pockets of weakness even before the Iran conflict. Fourth-quarter GDP rose just 0.7%, held back in part by the prolonged government shutdown and its downstream effects. So far this quarter, job creation has been soft, and consumer spending has also moderated. Even artificial intelligence-related data center construction, one of the brighter areas of economic activity over the past year, is beginning to face resistance from local communities concerned about energy costs and pressure on natural resources. Even so, our view is that much of the recent softness is likely temporary. Assuming the situation with Iran is contained in a timely manner, we believe there remains substantial capital on the sidelines and ample investment spending to support economic growth over the next several years.
FIXED INCOME STRATEGY: Fixed Income investors went on a wild ride to start 2026. After the Bloomberg Government/Credit Index was up 1.6% at the end of February (just prior to the start of the Iran conflict), the Index turned negative as much as -0.9%, only to finish the quarter down “just” -0.2%. U.S. Treasury bonds outperformed corporate bonds by 0.5% in Q1. Longer-duration bonds in both sectors realized the largest declines.
The Fed’s policy path from here is fraught with uncertainty. A slowing labor market should, on balance, favor lower interest rates. However, sticky inflation metrics – particularly with the massive spike in oil prices over the past month – could offset the need for more rate cuts. The duration of the Iran conflict, as well as whether commodity price spikes are contained as a demand-shock or result in sustained inflation, will have a meaningful impact.
CCM continues to favor an approach that barbells corporate bond exposure in shorter maturities (5 years or less) with U.S. Government bond exposure in the 5 to 10-year maturity range. This provides an embedded hedge against potential equity market weakness and risk-manages the effect of potential spread-widening in corporate bonds, which remain richly valued compared to historical metrics. We modestly increased our duration target to 5.0, which is defensive versus the index duration of 6.1, but reflects our increasingly constructive outlook on fixed income investments, particularly Treasuries in the 5 to 10-year range.
EQUITY STRATEGY: We have been struck by how resilient risk assets have remained since hostilities with Iran began. Traditional defensive areas such as Treasury bonds, gold, and more defensive equity sectors like health care and consumer staples have not provided the protection historically seen during times of market turmoil. Wall Street earnings estimates for the S&P 500 have continued to move higher, suggesting that analysts expect the conflict to have only a limited effect on corporate profits at the index level. That said, markets are unlikely to remain this complacent if the conflict becomes more prolonged or begins to place sustained pressure on energy prices. In that environment, consumer-oriented businesses would likely be among the most vulnerable, as higher gasoline prices leave households with less to spend on other goods and services.
Artificial intelligence continued to impact markets well beyond the technology sector in the first quarter, as investors reassessed which business models are built to withstand a more automated economy. While some companies tied to labor-intensive services or per-seat software pricing came under pressure, we believe the long-term winners are likely to be businesses with proprietary data, essential customer relationships, and the ability to use AI to strengthen their core offerings.
Our equity holdings have held up well on a relative basis. A meaningful contributor to that relative strength has been our underweight position in the Magnificent 7 group, which is down -12% year-to-date. We have taken a more measured approach to artificial intelligence-related investments, an area that has come under pressure amid growing concerns about overinvestment and rising public skepticism over AI’s longer-term economic impact. Our focus remains on identifying sectors and companies positioned to benefit from AI adoption, while avoiding those whose business models may be weakened or displaced by it.
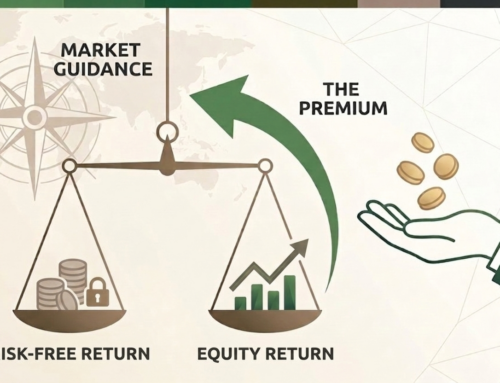
ASSET ALLOCATION: Our Equity Risk Premium (ERP) model continues to indicate that equities offer a modest return advantage over bonds, supporting a slight overweight in balanced portfolios. The model’s expected equity return has risen to its highest level since 2010. At the same time, the move higher in bond yields has narrowed that advantage, reducing the margin of safety for adding incremental equity exposure. As a reminder, the ERP framework measures the relative attractiveness of stocks by comparing their expected return to the yield available on long-term industrial bonds, reinforcing our view that asset allocation decisions should be made on a relative, not absolute, basis.
While the ERP remains a useful guide, it is not a standalone decision tool. The macro backdrop continues to present meaningful risks. A prolonged conflict with Iran has the potential to keep energy prices elevated, which would pressure both inflation and consumer demand. In addition, market leadership remains concentrated in a narrow group of large-cap stocks, leaving broader equity indices vulnerable should sentiment shift. Given these crosscurrents, we believe maintaining discipline is critical. We are comfortable with a modest equity overweight but see little justification for increasing risk exposure until the outlook becomes clearer.
Key investing risks include elevated equity valuations, the potential for unrest in the AI investing space, geopolitical risk (most recently Iran), and a resurgence in inflation. If your risk tolerance or circumstances have changed, please contact your adviser to adjust your investment policy accordingly.
CCM Investment Advisers, LLC is a Registered Investment Adviser registered with the U.S. Securities and Exchange Commission (CRD# 105743). Any type of investing involves risk of loss and there are no guarantees that the strategies described on this website or any of the associated literature may be successful. The opinions and information contained in this report are for informational purposes only and are not meant to be predictors of future results. Such opinions and information do not constitute an offer or solicitation to provide investment advisory services. Such an offer can only be made in states where CCM Investment Advisers is registered.
Any type of investing involves risk of loss and there are no guarantees that the strategies described may be successful. Any performance data reported represents historical data and future returns may differ significantly. Past performance does not guarantee future results. CCM Investment Advisers does not assume liability for any loss which may result from the reliance by any person upon such information or opinions.
Security, index and economic information are obtained from resources which CCM believes to be accurate but no warrant is made to the accuracy or completeness of the information. Various indices described and discussed herein are unmanaged; investments cannot be made directly into an index. Indices do not incur fees that reduce performance. The performance and volatility of an index or mix of indices will not be the same as a CCM client account.
The S&P 500 Index ® is a readily available, capitalization-weighted index of 500 stocks. The index is designed to measure performance of the broad domestic economy through changes in the aggregate market value of 500 stocks representing all major industries.
The Magnificent Seven are the seven largest stocks as measured by market capitalization in the United States. The Bloomberg Magnificent 7 Total Return Index is an equal-dollar weighted equity benchmark consisting of a fixed basket of the seven largest market capitalization companies classified in the United States.
The Barclay’s Government/Credit Index is the non-securitized component of the U.S. Aggregate Index. The index includes US Treasuries, government-related issues and corporate bonds.
Corporate bonds returns and U.S. Government bond returns reference the Bloomberg U.S. Corporate Total Return Index and Bloomberg U.S. Government Total Return Index, respectively.
The 50/50 Balanced Index is an index comprised of 50% S&P 500 stocks and 50% Barclay’s Government/Credit Index bonds.
The NASDAQ Composite Index is a readily available, capitalization-weighted index of over 2,500 domestic and international companies listed on the NASDAQ Stock Market.
Equity index valuation and earnings statistics are calculated using the Bloomberg Professional Service unless otherwise indicated.
All blended benchmarks are static blends.
Technical Terms:
The term federal funds rate refers to the target interest rate set by the Federal Open Market Committee (FOMC). This target is the rate at which commercial banks borrow and lend their excess reserves to each other overnight.
The Atlanta Fed GDPNow model is a real-time econometric model which forecasts GDP growth in the current quarter.
The Dividend Discount Model is a quantitative model used to predict the price of stocks based on the theory its price worth the sum of all future dividends discounted back to their present value.
The Consumer Price Index (CPI) is a measure of the monthly change in prices paid by consumers. The CPI consists of a bundle of commonly purchased goods and services. The Bureau of Labor Statistics (BLS) calculates the CPI as a weighted average of prices for a basket of goods and services representative of aggregate U.S. consumer spending.
The Producer Price Index (PPI) is a measure of inflation at the wholesale level. It’s compiled from thousands of indexes that measure producer prices by industry and product category and is published monthly by the U. S. Bureau of Labor Statistics (BLS)
The term duration measures how long it takes in years for an investor to be re-paid a bond’s price by the bond’s total cash flows. Duration can also measure the sensitivity of a bond’s or fixed income portfolio’s price to changes in interest rates.
The term equity risk premium refers to the excess return over bonds that investors demand to compensate for the greater risk for stocks.
The ISM Manufacturing index, also known as the purchasing managers’ index (PMI), is a monthly indicator of U.S. economic activity based on a survey of purchasing managers at manufacturing firms nationwide The ISM Services index is based on surveys sent to purchasing and supply companies of more than 400 services firms. Both are considered to be key indicators of the state of the U.S. economy.