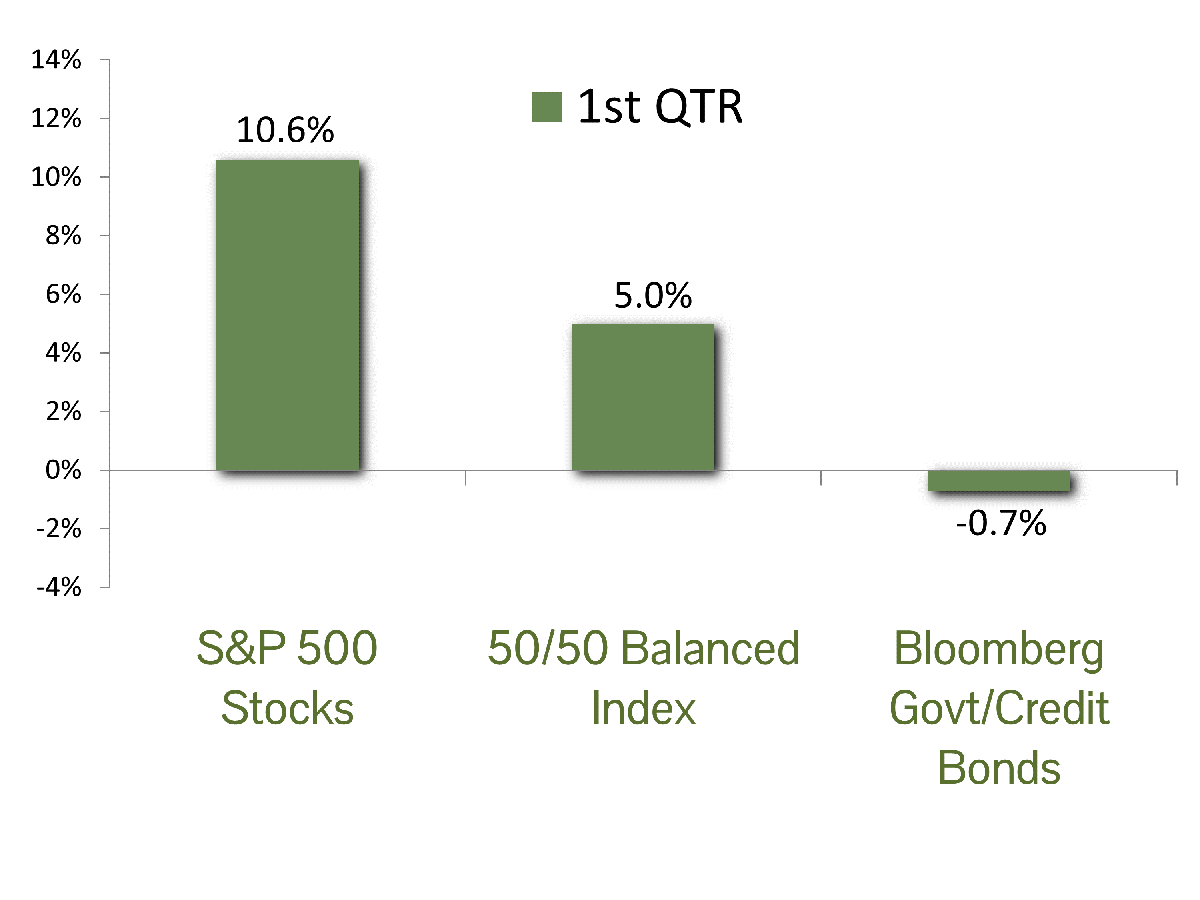
MARKET SUMMARY: The benchmark S&P 500 index surged by 10.6% in the first quarter of 2024, driven by robust economic conditions, anticipation of a forthcoming Federal Reserve easing cycle, and a fervor for Artificial Intelligence (AI) shares. In an unusual twist, the so-called “Magnificent Seven” stocks (Microsoft, Apple, Alphabet, Amazon, NVIDIA, Tesla, and Meta) were not the main propellants of the index’s performance during this period.
A more precise description for mega-cap tech shares in Q1 might be the “Magnificent Two”, as NVIDIA saw an astounding 82% gain while Meta rose by 37%. Both companies reaped the benefits of investor enthusiasm for anything related to AI. Excluding Apple, who is late to the AI game and declined nearly 11%, the remaining Mag-7 members roughly matched the S&P 500’s performance. As the Mag-7’s dominance waned, market breadth expanded—more issues advanced relative to decliners. This broader participation signals positive market health.
Meanwhile, the yield on the 10-year Treasury bond fell to 3.86% by the end of Q4 2023, as expectations centered on declining inflation and a less restrictive Federal Reserve rate policy. However, inflation stubbornly persisted throughout Q1 2024, making future rate cuts unlikely until the second half of the year. Consequently, interest rates inched up slightly during Q1, with the 10-year Treasury yielding 4.21% at quarter’s end. Due to the inverse relationship between interest rates and bond prices, the rate increase led to a modest 0.7% decline in the benchmark Bloomberg Government/Credit index during the first quarter.
ECONOMIC FORECAST: The U.S. economy is on track for modest but stable growth in 2024, with a projected GDP increase of 2.1%. This is a welcome shift from the recessionary fears at the beginning of 2023. While inflation has seen an uptick for the year-to-date, it is important to note that this rise is concentrated in a few key categories. Most goods and services are actually experiencing price stability or even deflation. This suggests inflation may moderate as the year progresses, with official forecasts predicting the Fed’s preferred measure of inflation, the Personal Consumption Expenditures (PCE) index, will fall to 2.4% by year-end, down from 3.8% in 2023.
The Federal Reserve’s plans for interest rate cuts have been adjusted due to the stickiness of inflation data. Initially anticipating six cuts in 2024, the futures market now expects only three. This shift reflects the Fed’s focus on balancing inflation control with economic health. However, the labor market remains a bright spot. The unemployment rate has stayed below 4% for a record-breaking 27 months, a level unseen since the 1960s. Recent Fed speeches indicate a growing belief that a robust labor market can coexist with controlled inflation.
While the current economic picture is encouraging, continued monitoring of inflation and its influence on monetary policy is essential. Maintaining a healthy economic trajectory in the coming months hinges on the Fed’s ability to navigate this evolving landscape.
FIXED INCOME STRATEGY: Fixed Income markets were characterized by competing narratives. Investors came into 2024 believing – and positioning for – the Federal Reserve to cut interest rates a total of six times in 2024 (a cumulative 1.50% reduction in the benchmark rate). By the end of Q1 that number had been halved, with expectations of just three cuts for 2024.
One narrative is that inflation has decidedly decreased from previously troubling levels. Federal Reserve Chair Jerome Powell has described the policy rate as being “sufficiently restrictive.” So, while not yet to the Fed’s 2% target, that goal appears within reach. The competing narrative shows that inflation measures pointed to unexpectedly persistent price increases, particularly in the closely watched “core” metrics, with both CPI and PPI coming in above expectations. Additionally, the labor market remains resilient. Taken together, this paints the picture of a stable economy, without any urgency to cut rates.
The week after the March FOMC meeting, where Powell indicated that it would likely be appropriate to start cutting rates later this year, Federal Reserve member Christopher Waller gave a speech titled “There’s Still No Rush.” As the title implies, his belief is that stable growth and stubborn inflation should dictate that there’s no imminent need for rate cuts.
For bond markets, the timing and magnitude of future cuts continues to be the pivotal question. Zooming out a bit relative to the time horizon, CCM believes multi-year total return prospects for fixed income markets remain compelling, particularly relative to stretched valuations in equities. The Fed’s next move will almost assuredly be an interest rate cut, so we have a good idea the path of interest rates will be lower in the coming years. Accordingly, we continue to incrementally extend duration, while shifting some of the asset allocation mix into bonds. We expect this to provide an effective hedge should equities underperform, while also catching a tailwind once the Fed starts cutting rates.
EQUITY STRATEGY: Last year’s strong finish continued into the first quarter as investors ignored heightened valuation concerns and were enthralled by the prospects for artificial intelligence (AI). Given the mania for AI-related stocks for this year, it is difficult to avoid drawing parallels from the action of such AI darlings as NVIDIA and Super Micro Computer to the late 1990’s technology bubble. Forward P/E ratios during the 1990’s surged above 25X, well after earnings growth rates began to decelerate mid-decade. Today they stand at a heady 21X. While the similarities are worrisome, there are essential differences in the market today.
For one, S&P 500 company earnings are growing at a healthy rate, with expectations for a 10% increase in 2024 and a further 12.4% rise the following year. As stated, the forward P/E ratio for the S&P 500 sits at 21X, or 1.3 standard deviations above historical averages. However, after removing the Magnificent 7 mega-cap stocks from the S&P 500, valuations improve to 19X forward earnings, or .7 standard deviations. NVIDIA, the poster child for AI investing, grew earnings by 400% in 2023, and the company expects earnings to double in 2024. Yet the stock only trades at 36x forward earnings. Index valuation levels make us cautious but clearly do not rise to the level of the irrational exuberance seen in the dot-com era.
Secondly, market concentration in unprofitable internet companies was the hallmark of the late 90’s market. While today’s Magnificent 7 stocks comprise an uncomfortable 28% of the S&P’s total market cap, investors are clearly paying more attention to fundamentals. Three of the seven names, Tesla, Apple, and Alphabet (Google’s parent company) returned less than the S&P 500 during the first quarter (and Microsoft barely outperformed). Also encouraging is that market participation is broadening to more companies within the S&P 500. Approximately 80% are now trading above their 200-day moving average.
These are all healthy signs that the market may be consolidating but is likely not a bubble that is about to burst. We expect more moderate returns over the coming months, allowing earnings to align better with current prices.
ASSET ALLOCATION: The U.S. economy continues to defy skeptics and is poised for another year of robust growth. As it relates to stocks, corporate profits are expected to benefit with an increase of 10% in 2024. However, the stock market appears somewhat exuberant, leading to stretched valuations. Forward profit/earnings (P/E) ratios have reached an elevated 21X. The number is skewed upward by the Magnificent-7, but is still high on an historic basis after those names have been omitted from the computation.
On the fixed income side of balanced portfolios, bond yields are attractive, even more so if inflation decreases as we anticipate. While we maintain cautious optimism about stocks due to strong economic fundamentals and market momentum, the relative appeal compared to bonds has diminished. Our strategic approach involves realizing some profits in stocks and reallocating the proceeds into bonds, typically intermediate-term Treasury issues. The end result is a slight overweighting in equities in balanced portfolios.
CCM Investment Advisers, LLC is a Registered Investment Adviser registered with the U.S. Securities and Exchange Commission (CRD# 105743). Any type of investing involves risk of loss and there are no guarantees that the strategies described on this website or any of the associated literature may be successful. The opinions and information contained in this report are for informational purposes only and are not meant to be predictors of future results. Such opinions and information do not constitute an offer or solicitation to provide investment advisory services. Such an offer can only be made in states where CCM Investment Advisers is registered.
Any type of investing involves risk of loss and there are no guarantees that the strategies described may be successful. Any performance data reported represents historical data and future returns may differ significantly. Past performance does not guarantee future results. CCM Investment Advisers does not assume liability for any loss which may result from the reliance by any person upon such information or opinions.
Security, index and economic information are obtained from resources which CCM believes to be accurate but no warrant is made to the accuracy or completeness of the information. Various indices described and discussed herein are unmanaged; investments cannot be made directly into an index. Indices do not incur fees that reduce performance. The performance and volatility of an index or mix of indices will not be the same as a CCM client account.
The S&P 500 Index ® is a readily available, capitalization-weighted index of 500 stocks. The index is designed to measure performance of the broad domestic economy through changes in the aggregate market value of 500 stocks representing all major industries.
The S&P 500 Growth Index ® is a stock index administered by Standard & Poor’s-Dow Jones Indices. As its name suggests, the purpose of the index is to serve as a proxy for growth companies included in the S&P 500. The index identifies growth stocks using three factors: sales growth, the ratio of earnings change to price, and momentum.
The S&P 500 Value Index ® is a stock index administered by Standard & Poor’s-Dow Jones Indices. As its name suggests, the purpose of the index is to serve as a proxy for value companies included in the S&P 500. The index identifies growth stocks using three factors: the ratios of book value, earnings, and sales to price.
The Barclay’s Government/Credit Index is the non-securitized component of the U.S. Aggregate Index. The index includes US Treasuries, government-related issues and corporate bonds.
The 50/50 Balanced Index is an index comprised of 50% S&P 500 stocks and 50% Barclay’s Government/Credit Index bonds.
The NASDAQ Composite Index is a readily available, capitalization-weighted index of over 2,500 domestic and international companies listed on the NASDAQ Stock Market.
All blended benchmarks are static blends.
Technical Terms:
The term federal funds rate refers to the target interest rate set by the Federal Open Market Committee (FOMC). This target is the rate at which commercial banks borrow and lend their excess reserves to each other overnight.
The Atlanta Fed GDPNow model is a real-time econometric model which forecasts GDP growth in the current quarter.
The Consumer Price Index (CPI) is a measure of the monthly change in prices paid by consumers. The CPI consists of a bundle of commonly purchased goods and services. The Bureau of Labor Statistics (BLS) calculates the CPI as a weighted average of prices for a basket of goods and services representative of aggregate U.S. consumer spending.
The term duration measures how long it takes, in years, for an investor to be repaid a bond’s price by the bond’s total cash flows. Duration can also measure the sensitivity of a bond’s or fixed income portfolio’s price to changes in interest rates.
The term equity risk premium refers to the excess return over bonds that investors demand to compensate for the greater risk for stocks.


