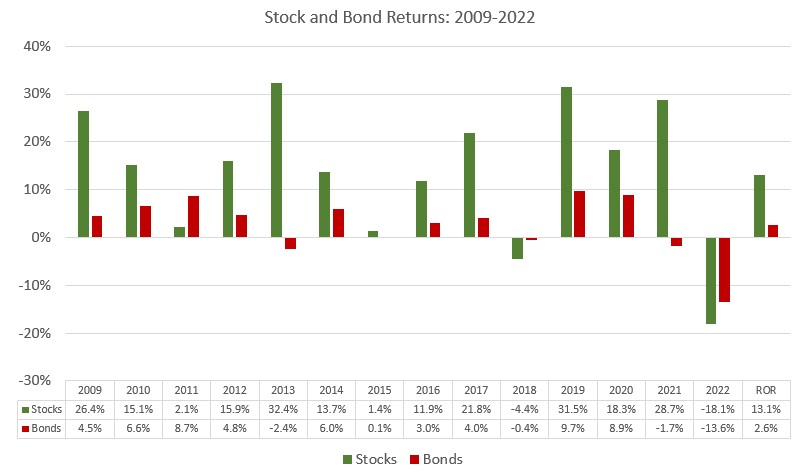
2022 will go down in history as perhaps the worst year for the combined performance of the stock and bond markets. With S&P 500 stocks down 18.1% and Barclay’s Government/Credit bonds down 13.6% last year, diversified balanced portfolios consisting of both stocks and bonds had virtually no chance of avoiding a big loss, and the traditional 60% stock/40% bond index declined 16.3% in 2022. Most of the balanced portfolios that we manage are more conservative and are typically benched versus a 50% stock/50% bond weighting. Even that index declined 15.9%, however (though the bulk of our portfolios outperformed the index by a wide margin).
With the carnage of 2022 behind us it is important to maintain perspective, as sometimes market performance does not fit neatly into one-year slices. Looking back to the Financial Crisis of 2008-2009 the picture is much rosier – particularly for stock investors.
Being true to their riskier nature, stock returns have varied greatly since the Crisis, ranging from a 30%-plus years in 2013 and 2019 to last year’s 18.1% decline. In the end, however, stocks have generated a compound annual rate of return of 13.1% over the 13-year period. Bond returns have been constrained by extremely low interest rates for the bulk of the period since the Crisis, and were hammered by their 13.6% loss in 2022 when interest rates finally rebounded. The compound rate of return for bonds since the Crisis is a puny 2.6%.
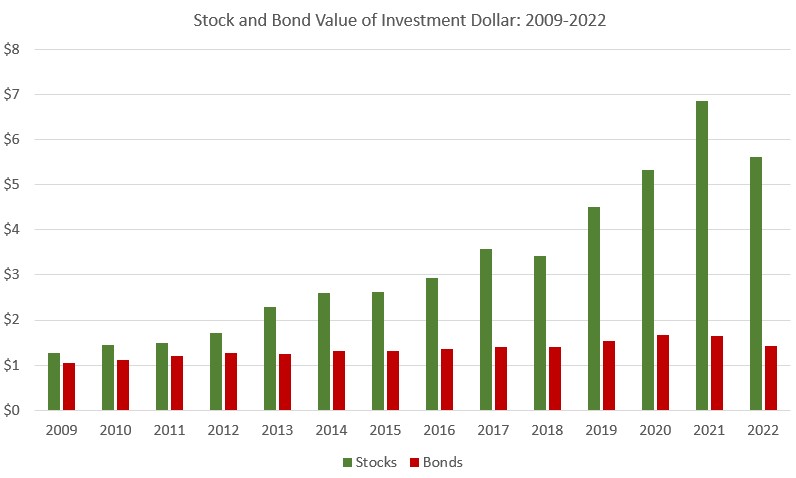
Shift from a viewpoint of rate of return to that of a value of investment dollar and the difference between stock and bond performance for the past 13 years is profound. As seen in the chart below, even after giving back 18.1% in 2022, one dollar invested in stocks at the beginning of 2009 grew five-fold over the period, ending with a value of $5.61. Due to the substandard performance of the bond market, the ending value of $1 invested in bonds was only $1.43.
The obvious implication for balanced portfolios is that the stock component has been the primary driver of performance. At CCM we were fortunate to have trusted our asset allocation system throughout the period and maintained an overweight position in equities in our balanced portfolios.
The rear view of the major asset class returns clearly illustrates the importance of a long-term view when investing. The United States is the most powerful and dynamic economy in the world, and its capital markets are primed for very generous performance in the long run. Returns do vary, however; this is the element we call risk. Although it may be hard to stomach in dreadful years such as 2022, in the long run it is merely a speed bump.


