
In 2020 the ARKK Innovation Fund was one of the top performing funds in the U.S., posting a total return in excess of 150%. While fund manager Cathie Wood is an expert on the small, disruptive, (and largely unprofitable) firms in which she focuses, we have long been suspicious of the fund’s strategy – particularly after having survived the great Tech Wreck in 2000, which saw the tech-heavy NASDAQ index decline over 75% after failing to live up to their hype.
Speaking of hype, after reaching certified investing star status after her tremendous year in 2020, Ms. Wood was ubiquitous in the investment news cycle as a talking head extolling the virtues of key ARKK holdings such as Teladoc Health. In December 2021 she posted a market commentary piece to her website that was stunning to professionals such as us whose ethics are unwavering – “(ARKK Innovation Fund) could deliver a 40% compound annual rate of return during the next five years.” Granted, it was a conditional statement, but without question it could easily be misconstrued by many retail investors in search of quick outsized returns.
Also on the topic of hype is the very nature of the typical ARRK Innovation Fund holding. Below are the top ten positions as of 4/28/22:
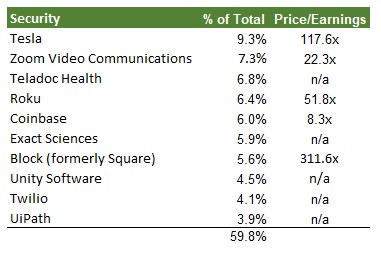
Of note, half of the positions lack a Price/Earnings ratio since there are no earnings to speak of. Two sport P/E ratios in excess of 100x (and for an auto manufacturer we believe Tesla’s valuation to be ridiculous). The remaining three at least trade within the bounds of reason (although for Coinbase anything is suspect, as they operate in one of the most overhyped sectors in the world – cryptocurrency). What is undeniably unreasonable is concentrating nearly 60% of the portfolio in a mere ten issues, defying almost all of the standards for proper portfolio diversification and risk management.
As we predicted early on, things would not end well for ARKK Innovation. Although Cathie Wood continued to dominate coverage in the investment press well into 2021, cracks in the strategy began to emerge. Despite the fact that 2021 was a banner year for tech stocks, with the S&P 500 Technology sector gaining 34.5%, the rising tide definitely did not raise all of the boats; by the end of the year the ARKK Innovation Fund had posted a loss of 24%. This was a staggering performance lag of 68.5% for the year.
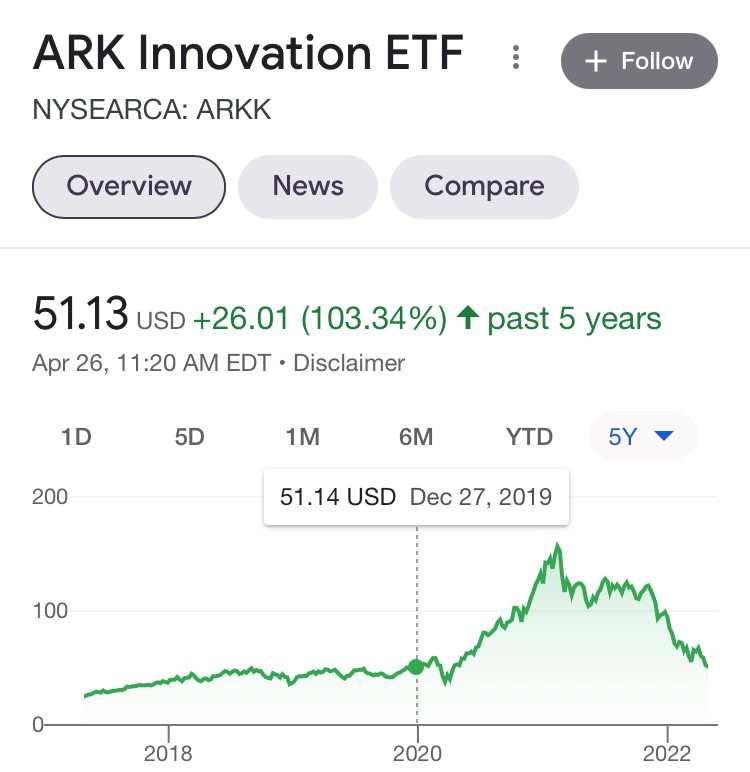
The pronounced decline in ARKK Innovation continued to pick up pace in 2022, and on April 26 the decline had become so severe that the entire 150% return from 2020 had been erased.
To add insult to the grievous injury, on April 28 Teladoc Health, which comprised 6.8% of the entire fund, announced earnings. Actually, instead of earnings they announced a record loss of $6.7 billion and slashed their forecast for future earnings. The stock declined over 40% and resulted in yet another decline for ARKK Innovation. In the end, what was one of retail investors’ darlings is now a major laggard:
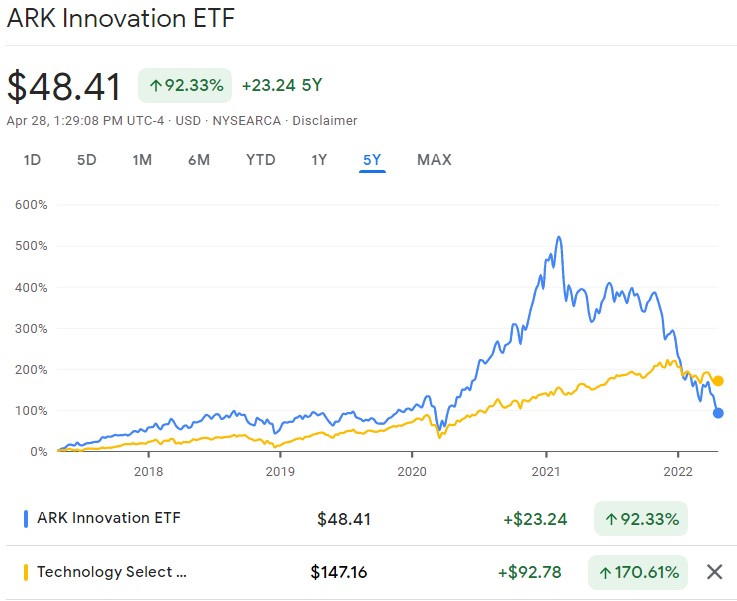
Over the past five years, ARKK Innovation has posted a total return of 92.3% (14% annual). Meanwhile, The S&P 500 Technology sector where CCM navigates has returned 170.6% (22% annual). The difference is a whopping 78% in total return.
Bottom line: An investing star emerges every year on Wall Street. Typically these investment managers employ hyper-focused trading strategies, and through random chance a select few will generate a greatly outsized investment return. However, it is extremely rare that this can be repeated on a consistent basis. When coupled with promises of further riches to follow instead of adherence to the industry standard footnote of “past performance is not indicative of future results, investors should take heed. Consistency ultimately wins the race.
CCM Investment Advisers, LLC is a Registered Investment Adviser registered with the U.S. Securities and Exchange Commission (CRD# 105743). The opinions and information contained in this report are for informational purposes only and are not meant to be predictors of future results. Such opinions and information do not constitute an offer or solicitation to provide investment advisory services. Such an offer can only be made in states where CCM Investment Advisers is registered. CCM Investment Advisers does not assume liability for any loss which may result from the reliance by any person upon such information or opinions.
Any type of investing involves risk of loss and there are no guarantees that the strategies described may be successful. Any performance data reported represents historical data and future returns may differ significantly. Past performance does not guarantee future results.
Security, index and economic information are obtained from resources which CCM believes to be accurate but no warrant is made to the accuracy or completeness of the information. Various indices described and discussed herein are unmanaged; investments cannot be made directly into an index.
The S&P 500 Index ® is a readily available, capitalization-weighted index of 500 stocks. The index is designed to measure performance of the broad domestic economy through changes in the aggregate market value of 500 stocks representing all major industries.
The NASDAQ Composite Index is a readily available, capitalization-weighted index of over 2,500 domestic and international companies listed on the NASDAQ Stock Market.
The Barclay’s Government/Credit Index is the non-securitized component of the U.S. Aggregate Index. The index includes US Treasuries, government-related issues and corporate bonds
The ICE BofAML 0-3 Month US Treasury Bill Index is a subset of ICE BofAML US Treasury Bill Index including all securities with a remaining term to final maturity less than 3 months.
All blended benchmarks are static blends.
Technical Terms (definitions sourced from Investopedia)
The compound annual growth rate (CAGR) measures an investment’s annual growth rate over a period of time, assuming profits are reinvested at the end of each year.
The term federal funds rate refers to the target interest rate set by the Federal Open Market Committee (FOMC). This target is the rate at which commercial banks borrow and lend their excess reserves to each other overnight.
The Consumer Price Index (CPI) is a measure of the monthly change in prices paid by consumers. The CPI consists of a bundle of commonly purchased goods and services. The Bureau of Labor Statistics (BLS) calculates the CPI as a weighted average of prices for a basket of goods and services representative of aggregate U.S. consumer spending.
The Producer Price Index (PPI) measures the average change over time in the prices domestic producers receive for their output. It is a measure of inflation at the wholesale level that is compiled from thousands of indexes measuring producer prices by industry and product category. The index is published monthly by the U.S. Bureau of Labor Statistics (BLS)


