A growing challenge for the equity market is concentration risk, defined as a high level of reliance in a portfolio on a particular security, group of securities or industry sector. We have written extensively on the high concentration in the FANG names (Facebook, Amazon, Netflix and Google), it’s broader extension FAANG (FANG plus Apple) or particularly the FAANG/M version (FAANG plus Microsoft). The phenomenon has increasingly extended itself to larger swathes of the market and creates a specific risk for equity investors.
Imagine a crowded theater with only two exits when the fire alarm goes off; there simply aren’t enough ways to get out. The equity market implications of investors increasingly concentrated in technology-related holdings are similar. Should there be a significant market correction, is there enough liquidity to allow the market to function properly when so much is concentrated in a thin slice of the market?
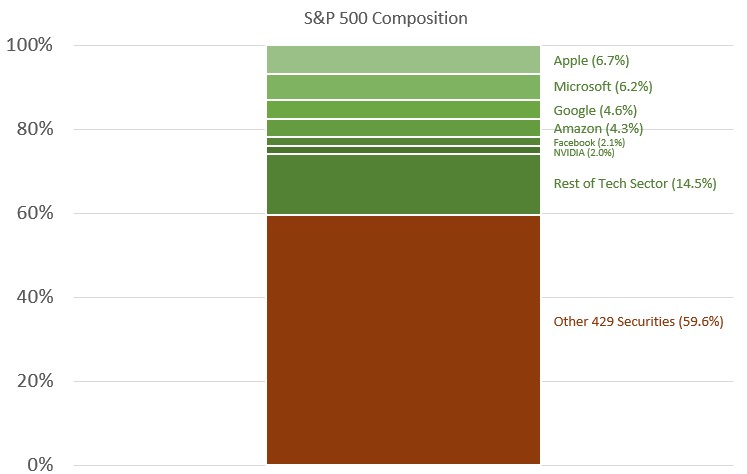
The S&P Technology sector now comprises a sky-high 29% share of the S&P 500 index. While frighteningly high in and of itself, the measure fails to fully account for FAANG shares assigned to different S&P sectors. Amazon, for instance, resides in the S&P Consumer Discretionary sector, and comprises a 4.3% share of the S&P 500. Google (aka Alphabet) and Facebook (recently renamed Meta Platforms) are members of the S&P Communications sector and sport S&P 500 shares of 4.6% and 2.1% respectively.
It is hard to question the technology lineage of Facebook and Google, as they were members of the S&P 500 Technology group before it was split into Tech and Communications. For Amazon, cloud computing lies at the core of their profit model. Therefore, including those three names in the Technology sector’s weighting increases the amount of the S&P 500 comprised of information technology securities to a staggering 40%. Investors are beginning to re-assess their valuation prospects for technology names, as rising interest rates decrease the value for future earnings for such growth-heavy positions. Should interest rates increase precipitously along with inflation, it could be a very rough landing for 40% of the market.
Regarding specific securities, the six names of FAANG/M comprise almost 25% of the entire 500-stock S&P 500. Include red-hot Tesla and NVIDIA and the number approaches 30%. That is an astonishing capitalization share for only eight securities (a mere 1.6% of the 500 names in the Index). The disconnect creates unique liquidity challenges should there be a rush for the exit, but also severely violates the fundamental investing concept of diversification. Any investor who chooses a passive investing strategy using Exchange Traded Funds such as the Vanguard S&P 500 ETF is inherently under-diversified, as 30% of their investment is in a mere eight names!
CCM’s response to these challenges is to remain true to our conservative roots, where proper diversification is one of our core tenets. While names such as Apple and Microsoft have S&P 500 shares in excess of 6%, we only target more manageable positions of around 3% in each. In the end, our exposure to FAANG/M names is less than 14% of our equity portfolio, and our overall exposure to information technology names is around 1/3 of the portfolio.
As we have discussed in the past, as long as the cultish devotion to the FAANG/M names (and in particular for Tesla) continues, simple math dictates that we will lag the top-heavy S&P 500 index in total return. However, when the cycle inevitably reverses course, it is highly likely the relative strength differential will swing heavily in our favor as was the case in 2001 and 2002 after the violent deflation of the Tech Bubble.
CCM Investment Advisers, LLC is a Registered Investment Adviser registered with the U.S. Securities and Exchange Commission (CRD# 105743). The opinions and information contained in this report are for informational purposes only and are not meant to be predictors of future results. Such opinions and information do not constitute an offer or solicitation to provide investment advisory services. Such an offer can only be made in states where CCM Investment Advisers is registered. CCM Investment Advisers does not assume liability for any loss which may result from the reliance by any person upon such information or opinions.
Any type of investing involves risk of loss and there are no guarantees that the strategies described may be successful. Any performance data reported represents historical data and future returns may differ significantly. Past performance does not guarantee future results.
Security, index and economic information are obtained from resources which CCM believes to be accurate but no warrant is made to the accuracy or completeness of the information. Various indices described and discussed herein are unmanaged; investments cannot be made directly into an index.
The S&P 500 Index ® is a readily available, capitalization-weighted index of 500 stocks. The index is designed to measure performance of the broad domestic economy through changes in the aggregate market value of 500 stocks representing all major industries.
The NASDAQ Composite Index is a readily available, capitalization-weighted index of over 2,500 domestic and international companies listed on the NASDAQ Stock Market.
The Barclay’s Government/Credit Index is the non-securitized component of the U.S. Aggregate Index. The index includes US Treasuries, government-related issues and corporate bonds
The ICE BofAML 0-3 Month US Treasury Bill Index is a subset of ICE BofAML US Treasury Bill Index including all securities with a remaining term to final maturity less than 3 months.
All blended benchmarks are static blends.
Technical Terms (definitions sourced from Investopedia)
Concentration risk is the risk to a portfolio of holdings being concentrated in a small group of issues or industries.
The term federal funds rate refers to the target interest rate set by the Federal Open Market Committee (FOMC). This target is the rate at which commercial banks borrow and lend their excess reserves to each other overnight.
The Consumer Price Index (CPI) is a measure of the monthly change in prices paid by consumers. The CPI consists of a bundle of commonly purchased goods and services. The Bureau of Labor Statistics (BLS) calculates the CPI as a weighted average of prices for a basket of goods and services representative of aggregate U.S. consumer spending.
The Producer Price Index (PPI) measures the average change over time in the prices domestic producers receive for their output. It is a measure of inflation at the wholesale level that is compiled from thousands of indexes measuring producer prices by industry and product category. The index is published monthly by the U.S. Bureau of Labor Statistics (BLS)


