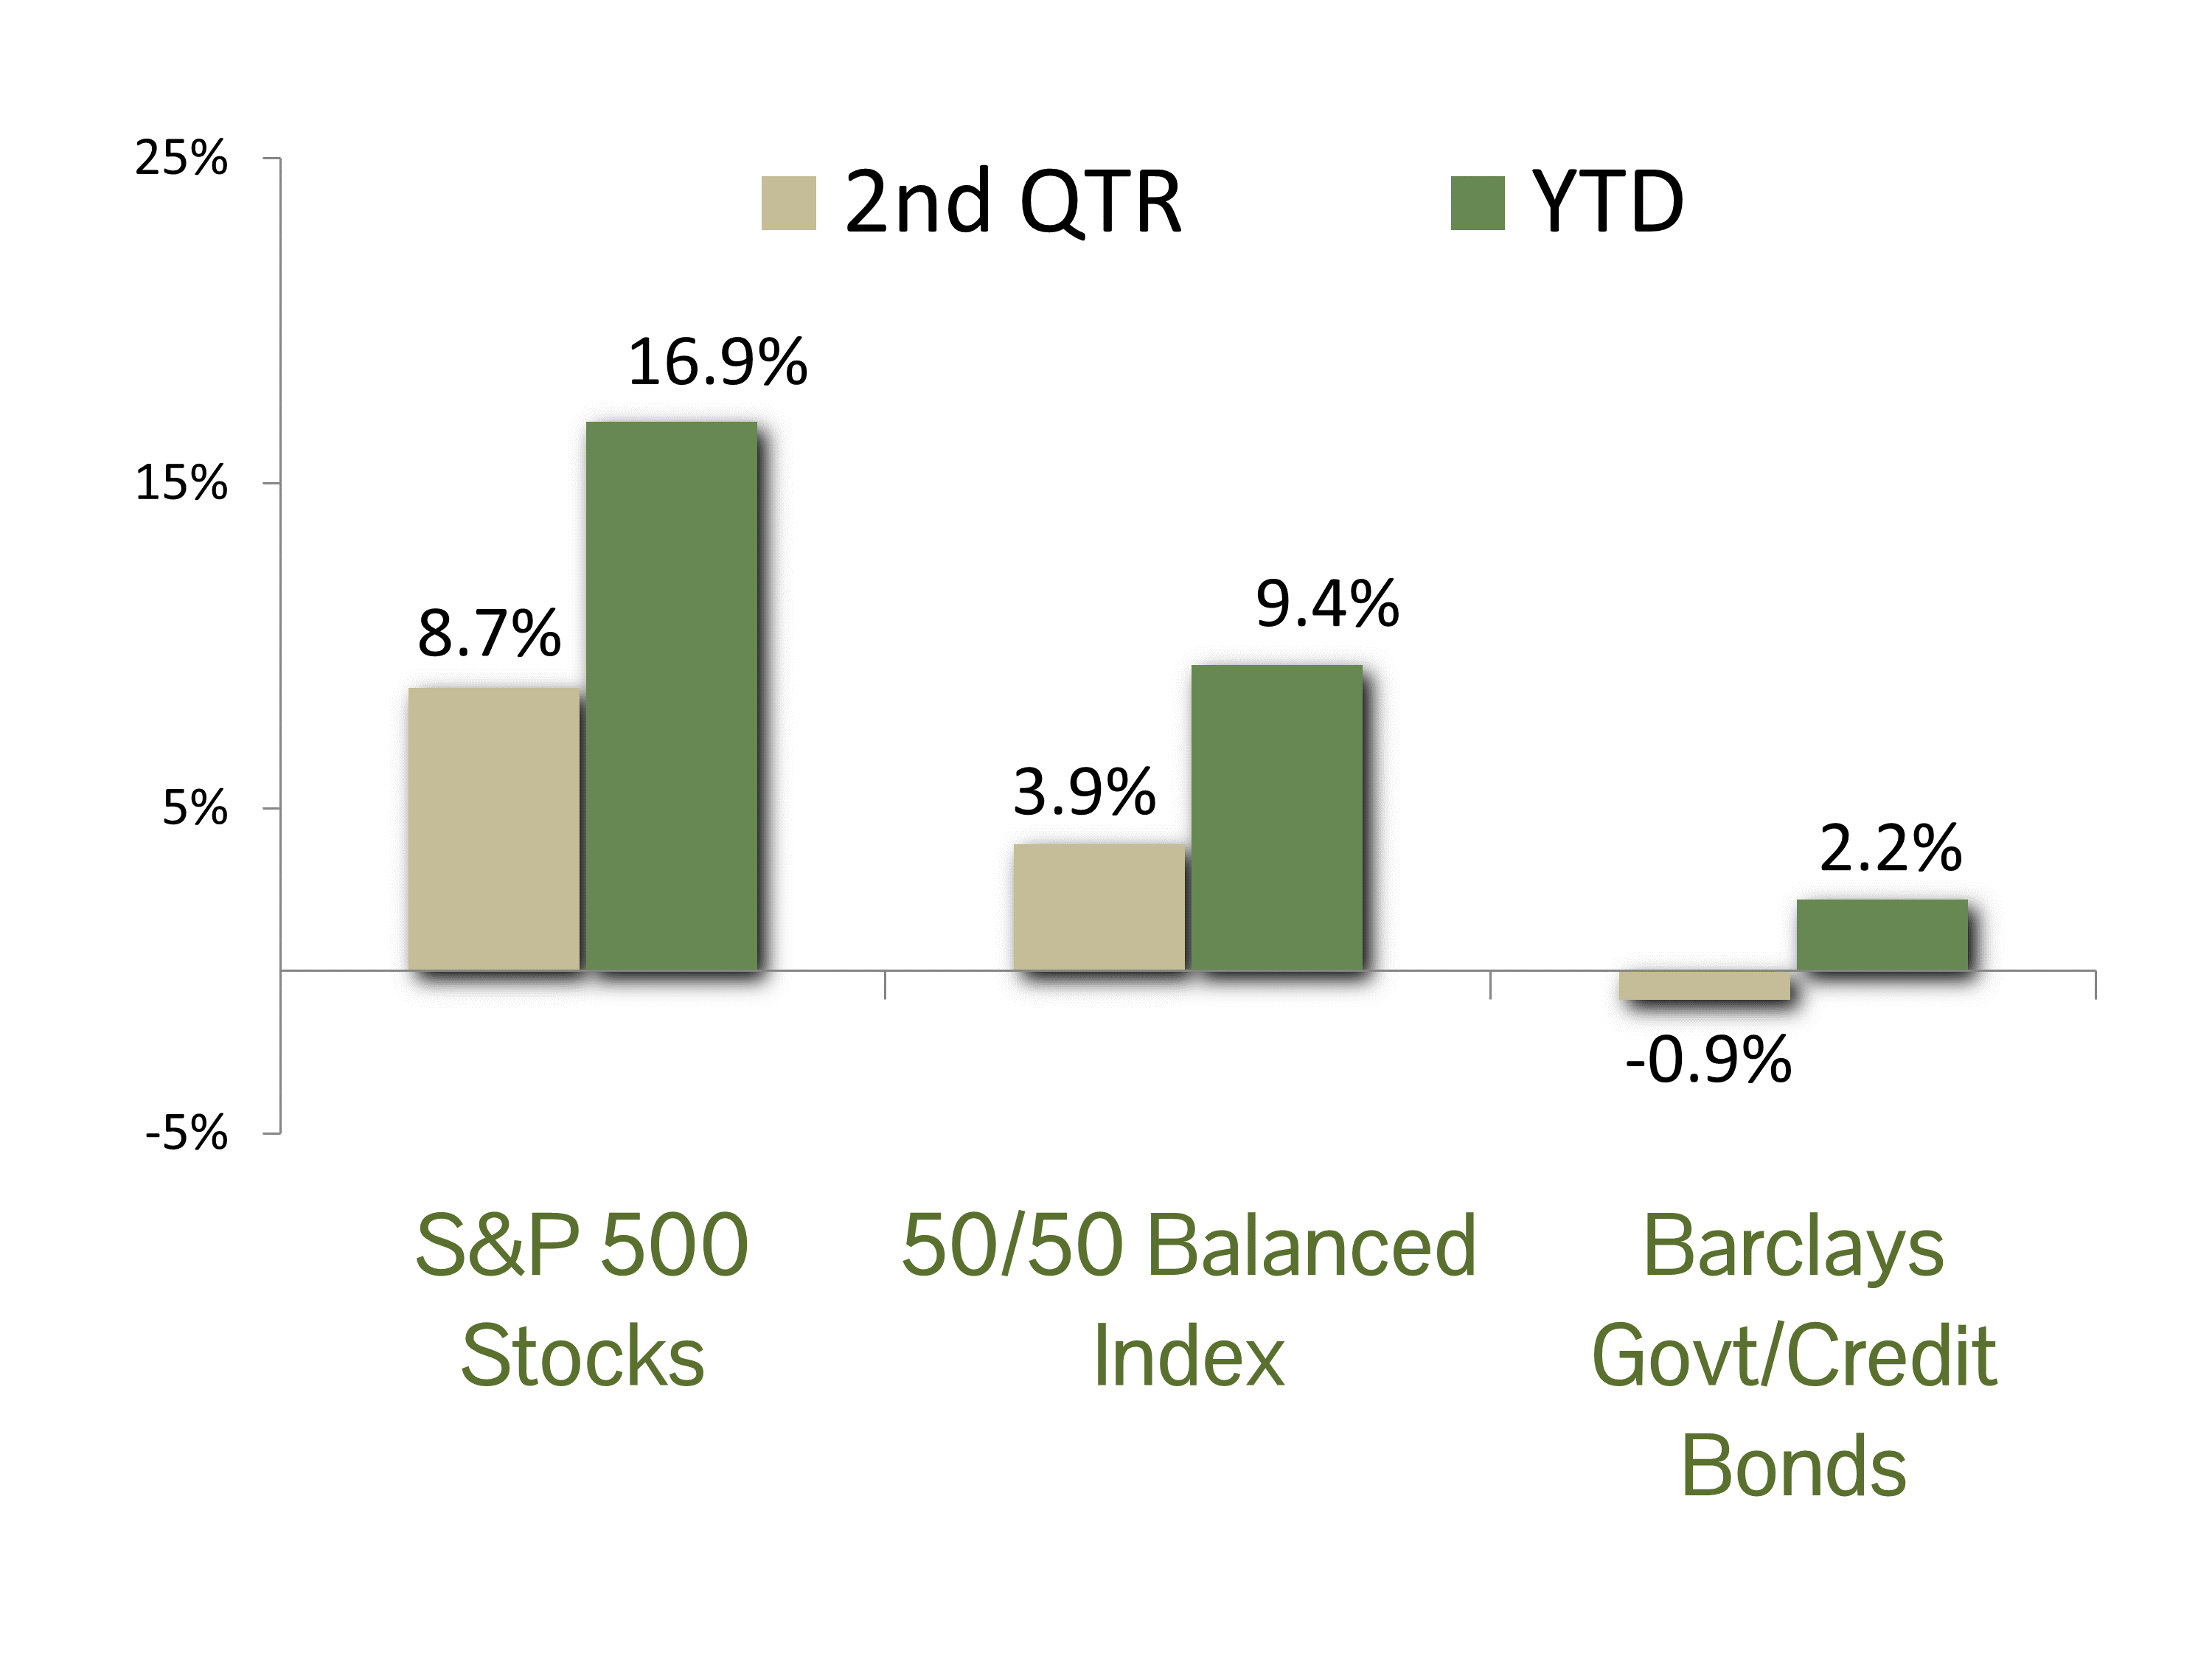
MARKET SUMMARY: The second quarter was awash with good news from both the economic and geopolitical fronts. The Federal debt limit impasse was ultimately reconciled, inflation continued to moderate, the banking crisis stabilized, and most importantly, after a year of relentless recession calls by Wall Street economists a U.S. slowdown still has failed to materialize. As expected, the result for the stock market was quite positive, with the benchmark S&P 500 index gaining 8.7% in the second quarter. This brings the index’s return for the year to 16.9%, and the gain since the market low in October to 25.9%.
Although 2023 stock performance has been impressive, the market has returned to its old playbook and gains have been highly concentrated in the mega-cap technology issues. As measured by the FANG+ index, a ten-stock index of the leading tech names (and eight of the largest components of the S&P 500), the elite group delivered a stunning 74.2% return in the first half. Since the ten names comprise a staggering 29% of the entire 500-stock S&P 500 index, this makes it very difficult for a diversified stock portfolio to match the index’s return. However, the “growth basket” approach we have employed of adding other high-flying tech positions (particularly those with exposure to transformative artificial intelligence) has allowed us to remain within reach.
The bond market was swayed by diametrical forces during the second quarter. On one side, declining odds for an economic recession provided an upwards push for interest rates. On the other, a significant taming in inflation and a hopeful end to the Fed’s string of interest rate hikes were moderators for rates. In the end the argument for a stronger economy was dominant and the yield on the 10-year Treasury increased from 3.47% at the beginning of the second quarter to 3.84% at the quarter’s end. Since bond prices and interest rates move in opposite directions, the net effect for the benchmark Barclay’s Government/Credit Bond index was a loss of 0.9% for the quarter. This pared the gain for bonds this year to 2.2%.
ECONOMIC FORECAST: The recession drumbeat has been muted in the past few months as many economic indicators point to a resilient economy. The labor market, in particular, has been strong, with the unemployment rate hovering near a four-decade low. June’s consumer confidence is the highest since January of 2022 on an improving job outlook from already elevated levels. Retail spending has been flat but positive during the quarter, while spending on services like travel continues to surge. The latest revision for the first quarter GDP improved from 1.3% to 2% on better than forecasted consumer strength and commercial construction activity. The Atlanta Fed GDP Now model estimates second-quarter GDP at 2.2%, while Bloomberg’s economic poll is a more conservative 1.2%. Based on this data, there is no indication of a recession in the near future.
The fly in the ointment for our no-recession call remains inflation and, more importantly, the central bank’s response to quell its growth. Fortunately, the Federal Reserve paused its interest rate hiking regime in June, which was welcomed news for those who believe inflation is headed back to target. The latest CPI release reported deflation in many categories, particularly within goods. Shelter is the one area that remains elevated, but there are signs it will begin to fall over the next couple of months. The Personal Consumption Expenditures Price Index, the Fed’s preferred inflation measure, fell to 3.8% in May, down from a high of 7% in June of last year. The futures market is currently pricing one more hike, but we believe they could be done for this cycle. We will be watching the next CPI report in mid-July for signs of mission accomplished.
FIXED INCOME STRATEGY: Monetary policy was punctuated with a “pause” by the Federal Reserve in June 2023, the first meeting since March 2022 where the FOMC did not raise rates. Strong economic data, particularly a stubbornly resilient labor market, are not making the Fed’s job of taming inflation any easier. With this in mind, Fed Chair Powell testified to Congress in late June that he and his peers who vote on interest rate policy see another two rate increases in the second half of 2023. Accordingly, we believe upward pressure on interest rates will remain, albeit likely lower in both speed and magnitude.
CCM’s fixed income strategy continues to favor a conservative approach. We have positioned portfolios cautiously, maintaining a defensive posture on duration positioning. Going forward, as rates continue to drift higher, we are marginally more constructive on increasing portfolio duration, opportunistically locking in higher yields. We continue to express this view through an up-in-quality approach, with U.S. Agency debt being our preferred method of capturing relative value without sacrificing liquidity. Agencies currently offer historically wide spreads relative to U.S Treasuries. High quality corporate and municipal bonds continue to have a place in portfolios as well, though we continue to favor shorter maturities to limit price volatility. This is consistent with our primary objectives of preservation of capital and risk management.
EQUITY STRATEGY: Artificial Intelligence (AI) has emerged as the most captivating investment opportunity since the dot-com frenzy of the late 1990s. While U.S. corporations have utilized AI technology for some time, the introduction of OpenAI’s ChatGPT has sparked widespread recognition and fascination among the general public and company executives alike. Although AI integration into corporate structures is still in its early stages, its potential to revolutionize innovation and profitability cannot be underestimated. Companies that skillfully incorporate it into their operations will undoubtedly gain a competitive advantage over the next decade.
The United States has been at the forefront of AI development, largely embracing its transformational possibilities. Company shares of early adopters have experienced significant appreciation, far surpassing the broader market’s performance. Notably, the UBS AI Winners Index, consisting of the top 40 U.S.-listed stocks leading the AI revolution, has generated an astonishing year-to-date return of 63.2%. CCM client portfolios have benefited significantly from investing in many of these innovative companies. The typical CCM all-equity portfolio has over 20% allocated to shares with exposure to AI.
While we recognize AI’s potential, avoiding over-concentration in client portfolios is crucial to long-term performance. We have written extensively in the past couple of years about concentration risks within the FANG stocks. Many companies in the FANG+ Index are at the forefront of AI and, as a result, have become more concentrated within the S&P 500 this year. We continue to maintain a cautious approach to mitigate concentration risk by avoiding excessive exposure to the FANG+ index, even if it means sacrificing some short-term performance.
ASSET ALLOCATION: Our asset allocation model points to a benchmark stock/bond allocation for the duration of the year. However, we have questioned the prevailing “wisdom” of a looming recession when key consumer-related economic data such as employment, income and spending remain historically strong. As recession naysayers, we decided to push back on the quantitative output from our model and remain modestly overweight equity exposure in balanced portfolios. The decision has worked well to date.
Our most recent refresh of the asset allocation model on June 30 was reassuring, as the long-term expected return for stocks from the increased significantly. The equity risk premium is now pushing plus-one standard deviation from the mean for stock exposure (a range we consider as “high confidence”). With the data now in sync with our fundamental assessment of the economy and markets our confidence in the call has strengthened. We will therefore maintain overweight equity exposure for at least the near term, countering the risk with an emphasis on quality in our equity selections and a defensive fixed strategy.
CCM Investment Advisers, LLC is a Registered Investment Adviser registered with the U.S. Securities and Exchange Commission (CRD# 105743). Any type of investing involves risk of loss and there are no guarantees that the strategies described on this website or any of the associated literature may be successful. The opinions and information contained in this report are for informational purposes only and are not meant to be predictors of future results. Such opinions and information do not constitute an offer or solicitation to provide investment advisory services. Such an offer can only be made in states where CCM Investment Advisers is registered.
Any type of investing involves risk of loss and there are no guarantees that the strategies described may be successful. Any performance data reported represents historical data and future returns may differ significantly. Past performance does not guarantee future results. CCM Investment Advisers does not assume liability for any loss which may result from the reliance by any person upon such information or opinions.
Security, index and economic information are obtained from resources which CCM believes to be accurate but no warrant is made to the accuracy or completeness of the information. Various indices described and discussed herein are unmanaged; investments cannot be made directly into an index.
The S&P 500 Index ® is a readily available, capitalization-weighted index of 500 stocks. The index is designed to measure performance of the broad domestic economy through changes in the aggregate market value of 500 stocks representing all major industries.
The S&P 500 Growth Index ® is a stock index administered by Standard & Poor’s-Dow Jones Indices. As its name suggests, the purpose of the index is to serve as a proxy for growth companies included in the S&P 500. The index identifies growth stocks using three factors: sales growth, the ratio of earnings change to price, and momentum.
The S&P 500 Value Index ® is a stock index administered by Standard & Poor’s-Dow Jones Indices. As its name suggests, the purpose of the index is to serve as a proxy for value companies included in the S&P 500. The index identifies growth stocks using three factors: the ratios of book value, earnings, and sales to price.
The Barclay’s Government/Credit Index is the non-securitized component of the U.S. Aggregate Index. The index includes US Treasuries, government-related issues and corporate bonds
The 50/50 Balanced Index is an index comprised of 50% S&P 500 stocks and 50% Barclay’s Government/Credit Index bonds.
The NASDAQ Composite Index is a readily available, capitalization-weighted index of over 2,500 domestic and international companies listed on the NASDAQ Stock Market.
The FANG+ Index is a equally-weighted index comprised of Meta, Apple, Amazon, Netflix, Microsoft, Alphabet, Tesla, NVIDIA, Snowflake and AMD. The index is rebalanced quarterly.
The UBS AI Winners basket tracks the performance of 40 US-listed stocks at the forefront of the Generative AI industry. Stock selection is based on input from UBS research analysts, specialty sales, and transcripts/reports. The basket has been optimized for liquidity with initial weights capped at 7% and trades $2.5bn in a day at 20% ADV.
All blended benchmarks are static blends.
Technical Terms:
The term federal funds rate refers to the target interest rate set by the Federal Open Market Committee (FOMC). This target is the rate at which commercial banks borrow and lend their excess reserves to each other overnight.
The Atlanta Fed GDPNow model is a real-time econometric model which forecasts GDP growth in the current quarter.
The Consumer Price Index (CPI) is a measure of the monthly change in prices paid by consumers. The CPI consists of a bundle of commonly purchased goods and services. The Bureau of Labor Statistics (BLS) calculates the CPI as a weighted average of prices for a basket of goods and services representative of aggregate U.S. consumer spending.
The term duration measures how long it takes, in years, for an investor to be repaid a bond’s price by the bond’s total cash flows. Duration can also measure the sensitivity of a bond’s or fixed income portfolio’s price to changes in interest rates.


