MARKET SUMMARY: Stock investors have been nervously awaiting it for months, and after a series of Federal Reserve interest rate hikes something finally broke. This time it was Silicon Valley Bank, and the contagion spread to a handful of banks (out of the 4,200 in the U.S.). Fortunately, no U.S. “too big to fail” banks have been caught up in the mess; the highest profile failure was in Europe, with Credit Suisse being absorbed by UBS, ending its 166-year run.
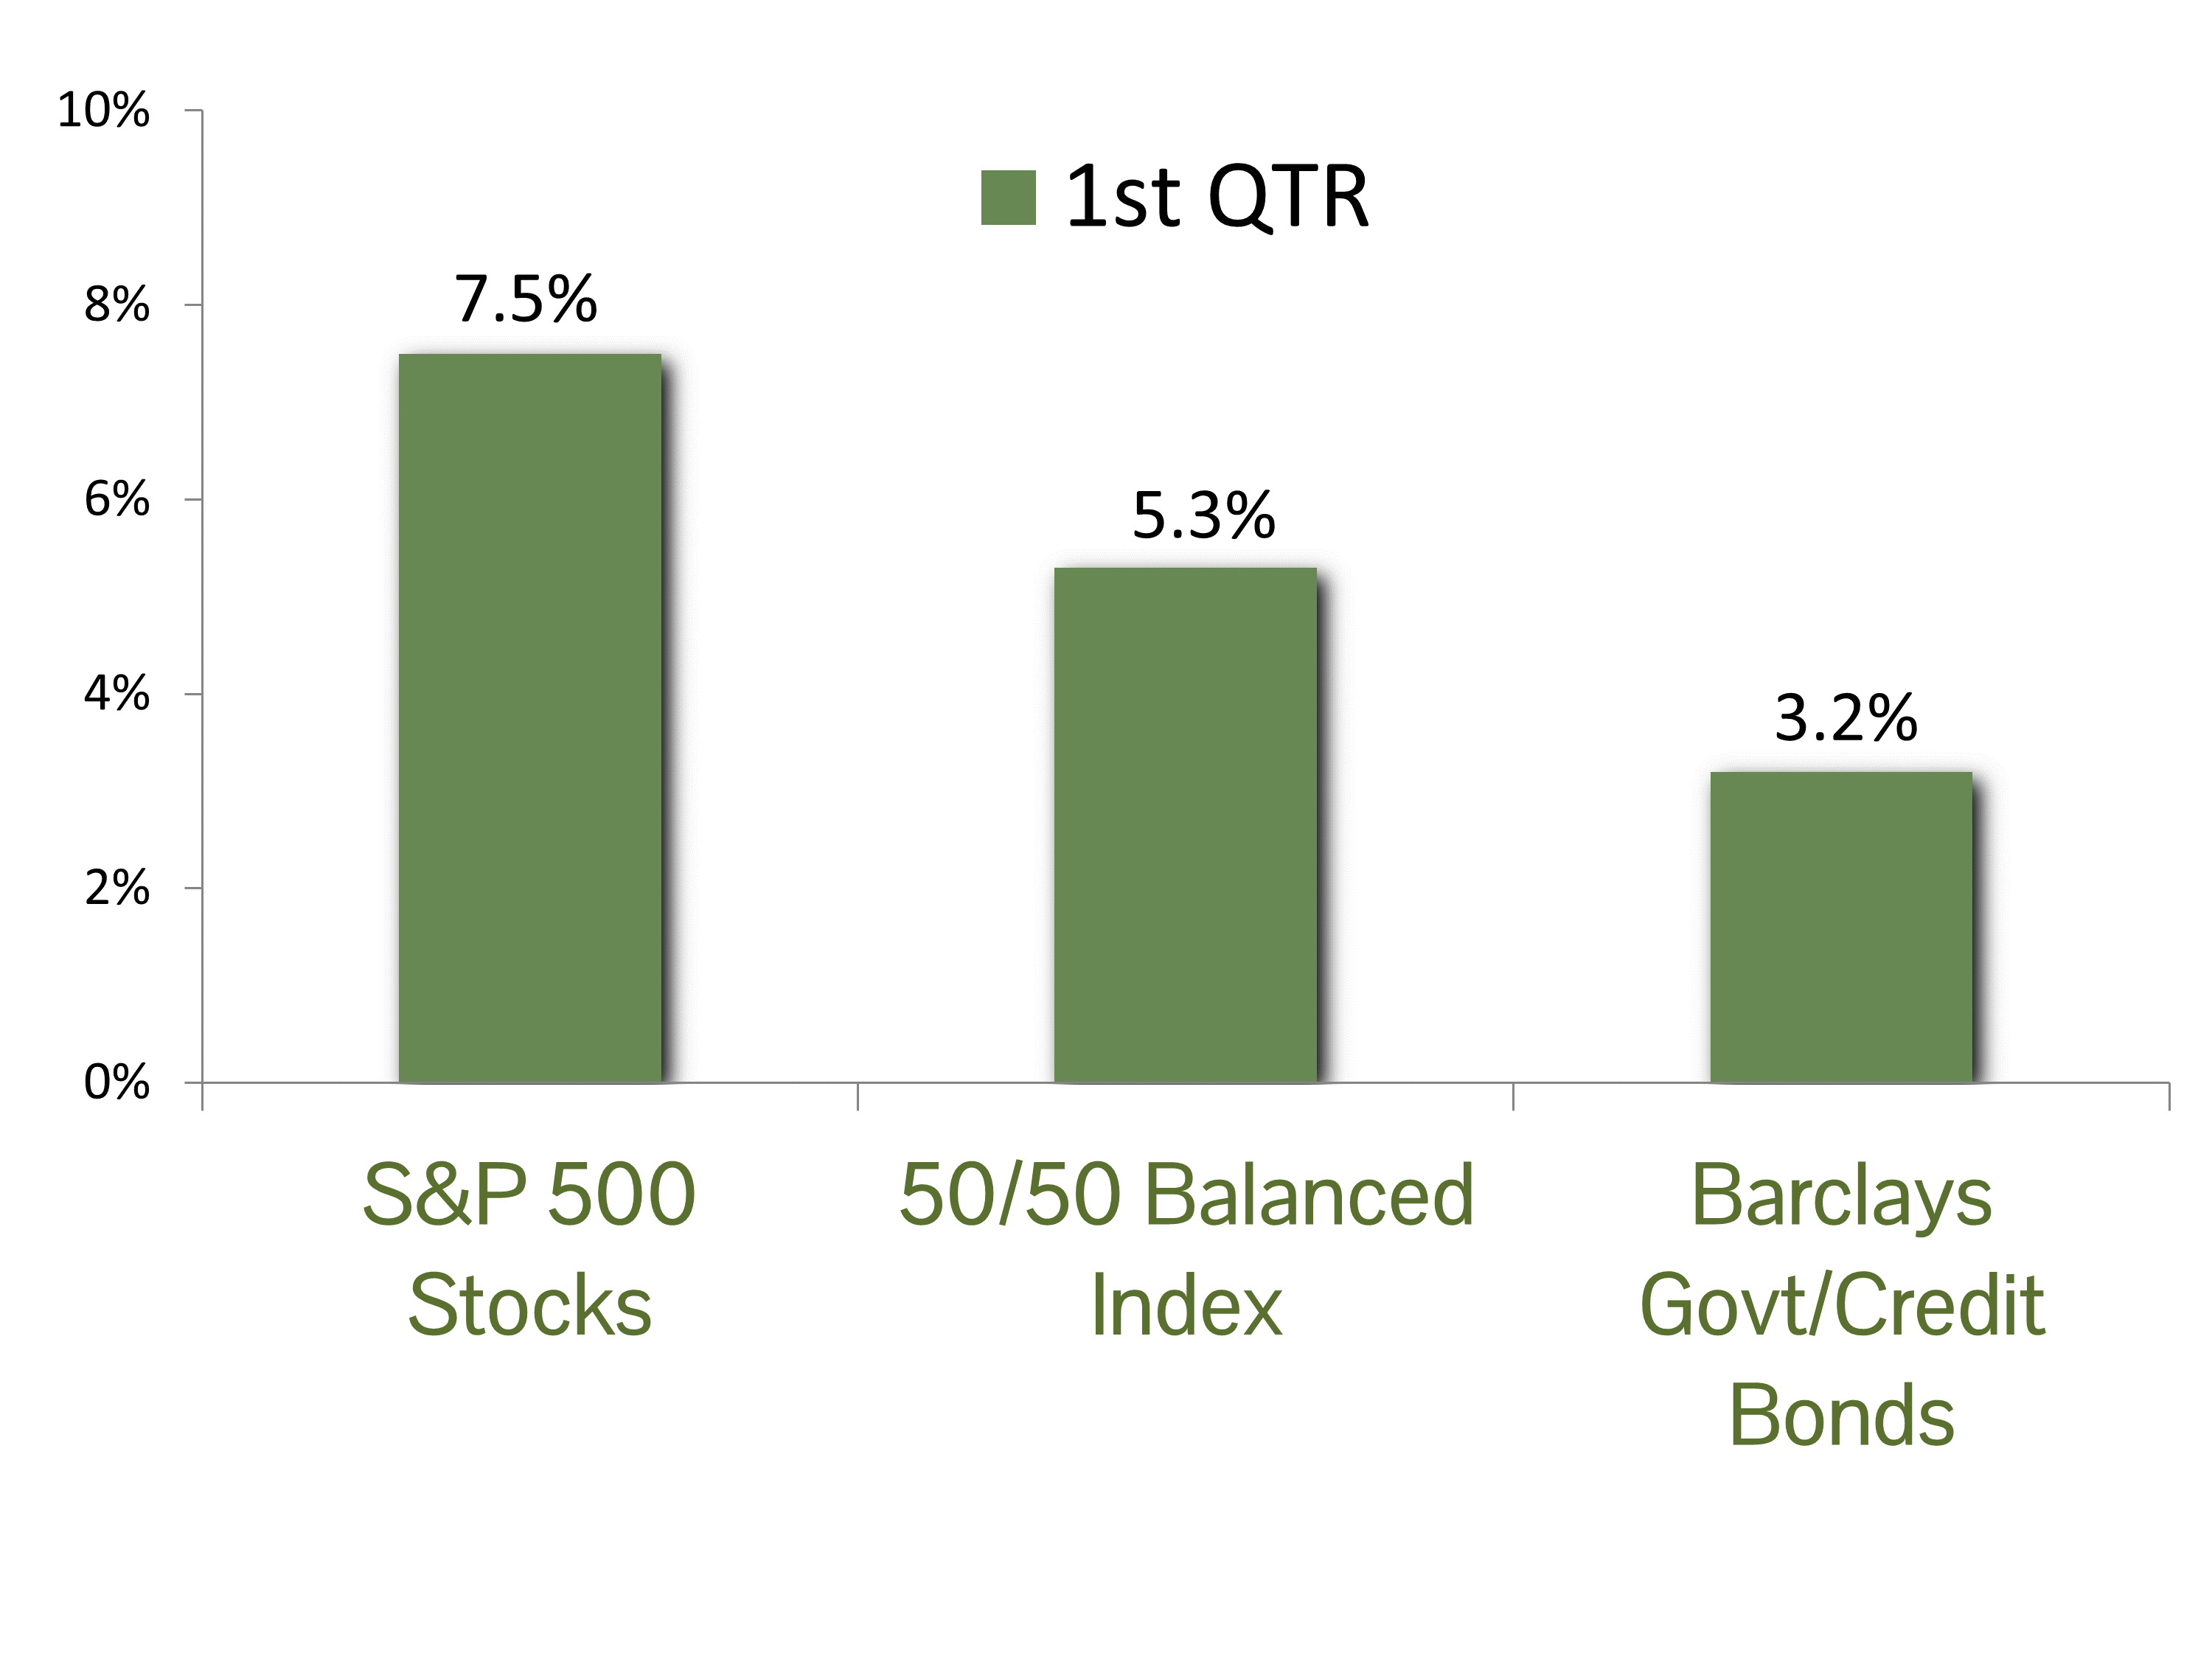
The banking chaos conjured old images of the 2008-2009 crisis and led to some market unrest, but it was still an exceptional quarter for S&P 500 stocks, with the index rising 7.5% in the first quarter. The market was highly fragmented, though, and the bulk of the gains were concentrated in the largest technology names – benefactors of declining interest rates during the quarter. The FANG+ Index, comprised of ten of the leading tech-related names, posted a total return of 39.2% in the quarter. Excluding those securities, the index was essentially unchanged. The biggest sector laggards were energy and finance, with respective declines of 4.7% and 5.6%.
The Federal Reserve continued its string of interest rate hikes in the first quarter and showed its resolve against inflation by executing its ninth rate increase – this despite the emergence of a banking crisis. Longer-term yields actually decreased though, as investors increased their subjective odds of a recession and lowered their inflation expectations. The yield on the 10-year Treasury declined from 4.25% in October to 3.47% at quarter’s end – effectively unwinding 75bps of the Fed’s initiative. Due to the inverse relationship between yields and price it was a very good quarter for bondholders. The benchmark Barclay’s Government/Credit Bond index posted a gain of 3.2% in the first quarter.
ECONOMIC FORECAST: The U.S. economy continues to send mixed signals about its future trajectory. Downside risks have undoubtedly risen due to the banking debacle, which could tighten credit access for businesses and consumers. Despite the ambiguity from a possible credit contraction, forecasts for growth have actually improved from the stall speed expectations when we began the year. According to the latest Bloomberg survey, economists now expect 1.5% economic growth in 2023.
Our outlook for economic growth is a bit above the consensus expectation for 2023, as we remain encouraged by the present situation – particularly the embedded economic momentum. The Atlanta Fed’s GDPNow real-time model forecasts 2.5% growth for the first quarter. The U.S. labor market remains robust, giving the all-important consumer the means to support growth. Wages are beginning to keep up with inflation gains, which will protect purchasing power. Despite news of tech sector layoffs, unemployment claims have remained consistently low. As infrastructure investments take effect, the job market will remain resilient and contribute to growth in the upcoming quarters. The Fed’s preferred gauge of inflation, the PCE price index, declined to 5% year-over-year in February. We expect inflation to continue to subside as consumer spending and supply chains normalize.
FIXED INCOME STRATEGY: The path of interest rates and future expectations of Fed monetary policy were inextricably linked to the banking crisis in the first quarter. The economy started the year on strong footing, with economic indicators and inflation readings consistently coming in above consensus. This set the tone for Fed Chair Powell’s testimony before the Senate Banking Committee on March 7th, where he opened the door to reaccelerating the pace of interest rate hikes and a higher peak policy rate than previously expected. The reaction in fixed income markets was sharp and swift, with the yield on 2-year Treasury notes briefly surpassing the 5% mark. However, by the following Friday the yield had precipitously fallen to 3.75%, as the liquidity issues seen at Silicon Valley Bank, Signature Bank, and Credit Suisse prompted a flight to quality. By the time the FOMC meeting commenced on March 22nd, the Fed raised rates only 25 basis points, while giving a nod to greater uncertainty and expected increases in funding costs due to banking stress. The 2-year yield ended the quarter at 4.10%, well off the stress-level lows but significantly lower than the highs of 5.10%.
The spreads on financial institution corporate bonds over Treasuries ended the quarter at 164 basis points, or 25 basis points wider YTD. This highlights the elevated volatility in corporate bond prices. While the outlook for additional interest rate increases looks less certain, we believe volatility in credit spreads will likely remain elevated. As a result, we are marginally more constructive on increasing portfolio duration but favor an up-in-quality approach, primarily utilizing Treasuries, high quality corporate or municipal bonds. This is consistent with our primary objectives of risk management and preservation of capital.
EQUITY STRATEGY: Equity performance this year has been bolstered by growth-oriented shares, with the S&P 500 Growth Index outperforming its Value counterpart by 4.46%. During the 2022 selloff we began adding to a “growth basket” of high-growth companies, and their run during the recent market recovery has boosted equity performance. Their strong performance has also continued their outsized effect on the S&P 500. While their overall weighting is down from 2021 highs, the two largest names in the S&P 500, Apple and Microsoft, now represent over 12% of the S&P 500 index. Risk management through diversification precludes us from owning a full index share in such mega-cap companies, yet we are aiming to capture the lion’s share of the excess return from the group by allocating to the “basket” of other high-growth names.
We remain largely agnostic on sector weightings, as relative valuations remain close to historical norms. Our largest overweight is in technology-related shares as they remain the primary engine of growth in the U.S. We are also overweight in the healthcare sector, and expect long-term outperformance given the demographic trends in the U.S. and the developing world. The recent turmoil in the regional banks caused us to reevaluate our exposure to smaller banks. We expect the recent outflows of deposits in favor of money market funds (a process known as “disintermediation”) to be long-lasting, which hurts profitability. In response we are maintaining an overweight in large, well-regulated banks, which are expected to benefit from the upheaval.
ASSET ALLOCATION: From a purely quantitative perspective, our asset allocation model is indifferent between stock and bond exposure, as the expected return spread between stocks and bonds is in line with the long-term average. We augment our process with qualitative measures, though, and we are maintaining a modest overweight position in equities in balanced portfolios. Our reasoning is based on our confidence in our “soft landing” outlook for the economy. With such a healthy job market and a substantial war chest of old COVID relief funds still in reserve, the consumer sector remains healthy. With consumers comprising two-thirds of the overall economy, this should allow the economy to muddle along with growth in the 2% range. This should provide propulsion for stocks and place a bit of upside pressure on interest rates. We are countering the risk from incremental stock exposure with a defensive, risk-off position on the bond portion of the portfolio.
Any type of investing involves risk of loss and there are no guarantees that the strategies described on this website or any of the associated literature may be successful. Performance data reported represents historical data and future returns may differ significantly. Past performance does not guarantee future results. Please see important disclosures below.
CCM Investment Advisers, LLC is a Registered Investment Adviser registered with the U.S. Securities and Exchange Commission (CRD# 105743). Any type of investing involves risk of loss and there are no guarantees that the strategies described on this website or any of the associated literature may be successful. The opinions and information contained in this report are for informational purposes only and are not meant to be predictors of future results. Such opinions and information do not constitute an offer or solicitation to provide investment advisory services. Such an offer can only be made in states where CCM Investment Advisers is registered.
Any type of investing involves risk of loss and there are no guarantees that the strategies described may be successful. Any performance data reported represents historical data and future returns may differ significantly. Past performance does not guarantee future results. CCM Investment Advisers does not assume liability for any loss which may result from the reliance by any person upon such information or opinions.
Security, index and economic information are obtained from resources which CCM believes to be accurate but no warrant is made to the accuracy or completeness of the information. Various indices described and discussed herein are unmanaged; investments cannot be made directly into an index.
The S&P 500 Index ® is a readily available, capitalization-weighted index of 500 stocks. The index is designed to measure performance of the broad domestic economy through changes in the aggregate market value of 500 stocks representing all major industries.
The S&P 500 Growth Index ® is a stock index administered by Standard & Poor’s-Dow Jones Indices. As its name suggests, the purpose of the index is to serve as a proxy for growth companies included in the S&P 500. The index identifies growth stocks using three factors: sales growth, the ratio of earnings change to price, and momentum.
The S&P 500 Value Index ® is a stock index administered by Standard & Poor’s-Dow Jones Indices. As its name suggests, the purpose of the index is to serve as a proxy for value companies included in the S&P 500. The index identifies growth stocks using three factors: the ratios of book value, earnings, and sales to price.
The Barclay’s Government/Credit Index is the non-securitized component of the U.S. Aggregate Index. The index includes US Treasuries, government-related issues and corporate bonds
The 50/50 Balanced Index is an index comprised of 50% S&P 500 stocks and 50% Barclay’s Government/Credit Index bonds.
The NASDAQ Composite Index is a readily available, capitalization-weighted index of over 2,500 domestic and international companies listed on the NASDAQ Stock Market.
The FANG+ Index is a equally-weighted index comprised of Meta, Apple, Amazon, Netflix, Microsoft, Alphabet, Tesla, NVIDIA, Snowflake and AMD. The index is rebalanced quarterly.
All blended benchmarks are static blends.
Technical Terms:
The term federal funds rate refers to the target interest rate set by the Federal Open Market Committee (FOMC). This target is the rate at which commercial banks borrow and lend their excess reserves to each other overnight.
The Atlanta Fed GDPNow model is a real-time econometric model which forecasts GDP growth in the current quarter.
The Consumer Price Index (CPI) is a measure of the monthly change in prices paid by consumers. The CPI consists of a bundle of commonly purchased goods and services. The Bureau of Labor Statistics (BLS) calculates the CPI as a weighted average of prices for a basket of goods and services representative of aggregate U.S. consumer spending.
The term duration measures how long it takes, in years, for an investor to be repaid a bond’s price by the bond’s total cash flows. Duration can also measure the sensitivity of a bond’s or fixed income portfolio’s price to changes in interest rates.


