In January we received an early cue from our asset allocation model for a future reduction in equity exposure, largely due to higher interest rates. With the escalating situation in Ukraine our economic outlook has weakened (see our February Economic Update for further detail), and the expected return for stocks has declined in kind. Accordingly, we have reduced our target allocation for equity exposure in balanced portfolios. In the spirit of full transparency and to provide a better understanding of our process, we offer a primer on the CCM asset allocation process and its current investment implications.
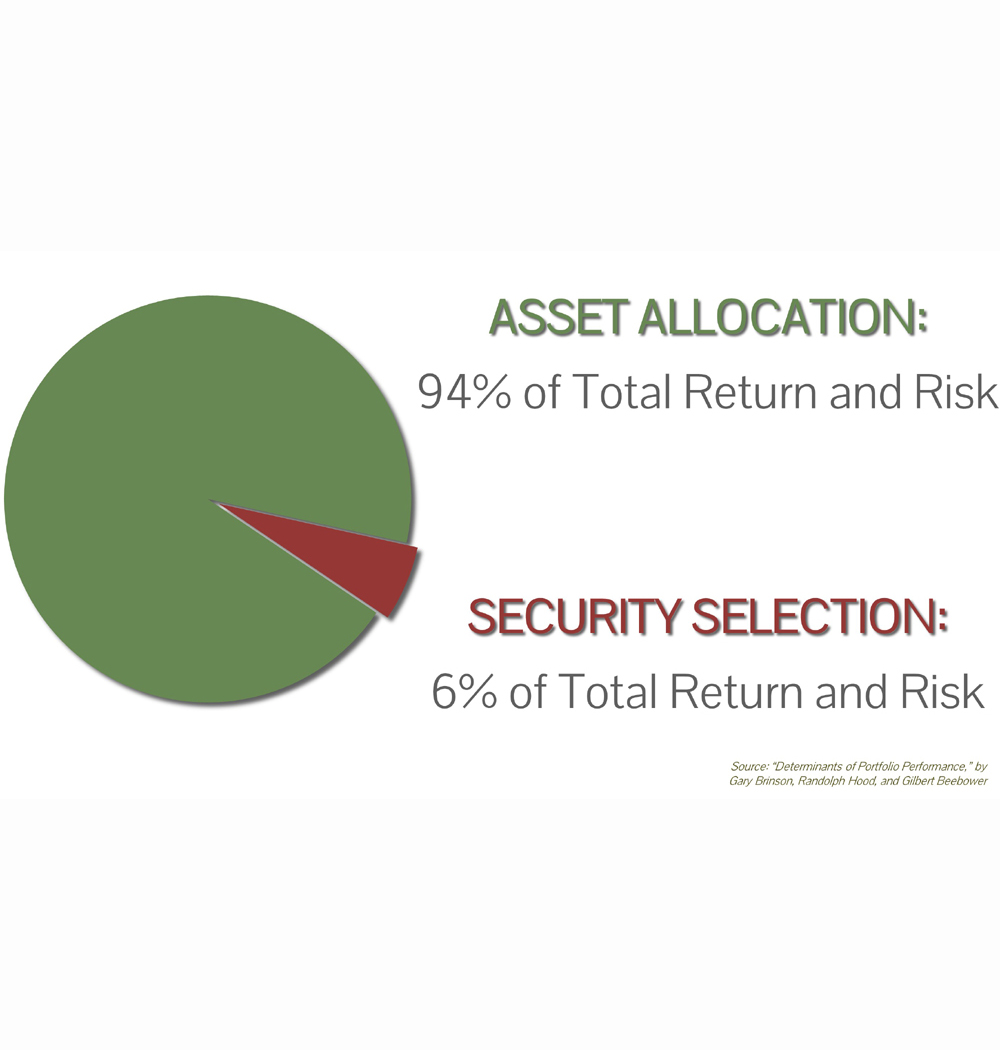
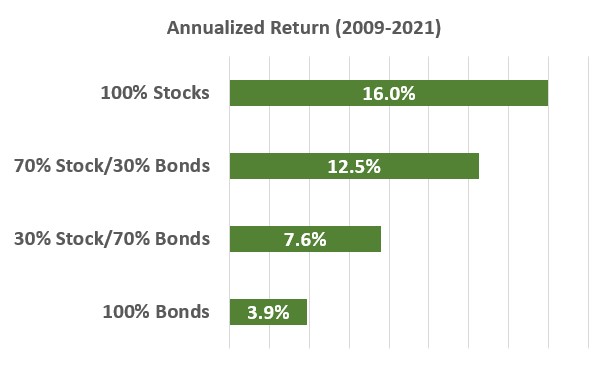
Importance of Asset Allocation: The most important determinant of an investment portfolio’s return is the asset allocation decision; over 90% of a portfolio’s risk and return is attributable to asset allocation, not security selection within the asset classes. A timely example is drawn from the investment cycle since the end of the Great Financial Crisis in 2009 through the end of 2021. During this 13-year period stocks generated an annualized rate of return of 16.0% while bonds delivered a total return of 3.9%. Obviously, for balanced portfolios invested in stocks and bonds, this 12.1% return discrepancy results in widely diverging returns depending on the asset mix of the portfolio. Consider the following:
Conservative Balanced Portfolio with a 50% stock/50% bond baseline allocation
- Overweight stocks/underweight bonds in a 70% stock/30% bond mix: 5% annualized rate of return
- Underweight stocks/overweight bonds in a 30% stock/70% bond mix: 6% annualized rate of return
The difference between the two portfolios is a 4.9% annual return discrepancy, and over the 2009-2021 period the ending monetary difference is staggering:
- For a $1,000,000 portfolio with a 70%/30% asset mix the ending value is $4,623,627.
- For a $1,000,000 portfolio with a 30%/70% asset mix the ending value is $2,591,550.
To make up for a tactical asset allocation error of this magnitude by security selection (i.e., stock picking) would require beating the stock market by 16% per year. Outperforming by 2-3% is a major investing achievement; 16% is almost statistically impossible.
Methods for Determining Asset Allocation: With the importance of proper asset allocation established, there are two basic methods for establishing a portfolio’s asset mix – qualitative and quantitative. A qualitative method is based on an investor’s assessment of the investing environment. For example, if the economy is healthy and stock valuations appear reasonable the investor decides to overweight stocks in a balanced portfolio. If a recession is judged nigh and valuations seem rich, stocks are underweighted in a balanced portfolio.
The major deficiency of a purely qualitative investing style is that it is easily swayed by human emotion and biases. For investors, the most pervasive emotions are fear and greed. Fear is arguably the more destructive of the two, as during times of crisis when investors are prone to “dumping stocks” the market is often at its cheapest. We witnessed this behavior in March 2020, the nadir for a COVID-panicked stock market, as well as the current re-pricing of stocks due to the war in Ukraine. At the other end of the spectrum, greed can prove to be costly as well. Investors piling into technology stocks regardless of their price in the late 1990’s were punished with losses in excess of 75%. It took fifteen long years for technology stocks to fully recover.
A quantitative method for establishing asset allocation employs formal valuation tools and an established process as a guide for determining the portfolio’s asset mix. The approaches may vary, but the typical purpose of such models is to determine the valuation of stocks relative to bonds. Qualitative considerations may be used to assess confidence levels or to stress test the quantitative results, but in the end the driving factor in the asset allocation decision is the measured relative valuation of stocks versus bonds. This is the type of system employed by CCM and is the reason we have maintained the discipline to overweight stocks for the entirety of the current 13-year bull market.
The Equity Risk Premium Model: CCM’s quantitative asset allocation model is based on the concept of the Equity Risk Premium. In its theoretical form, the equity risk premium is the excess return investors demand from stocks to offset their higher risk. Mathematically it is expressed as:
Equity Risk Premium = Market Return from Stocks – Risk-Free Rate of Return
As stated above the equity risk premium has no predictive power; it is merely quantifying an investing reality. However, by moving from actual market return to expected market return we are then assessing a future event and have a tool with predictive power. Expected return is by far the most critical part of our asset allocation model. However, it is also the trickiest to calculate.
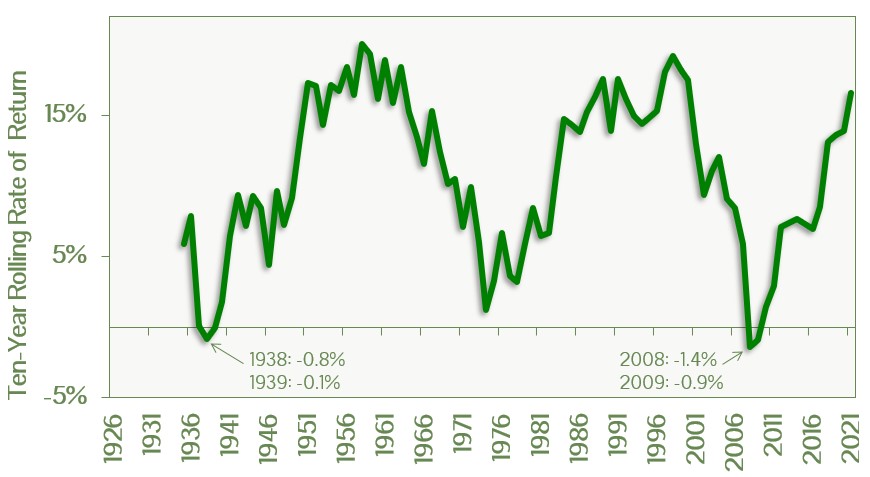
Forecasting Expected Return for Stocks: Forecasting the future path for the stock market is extremely difficult on a short-term basis. Longer-term rates of return are a bit easier, as the market has a central tendency to mean-revert to its 1926-2021 average annual return of just over 10%. However, as seen in the chart below, ten-year rolling rates of return for stocks can vary significantly. This even includes two distinct periods where 10-year rates of return were negative – the periods including the Great Depression and the Great Financial Crisis (the so-called “Lost Decade”).
The Dividend Discount Model: Thankfully, Modern Portfolio Theory gives us an array of quantitative tools for forecasting expected return for stocks. CCM uses the Dividend Discount Model (also known as the Gordon Growth Model). A full explanation of the model demands substantial space, but in summary this conceptual framework posits that the value of an equity security is equal to the value of its future dividend payments discounted to their present value. CCM uses the Dividend Discount Model provided by one of our data providers, Vestek Systems. As of 2/28/22 the model’s estimate for long-term stock returns stands at 10.4%.
Establishing the Expected Return Spread: With an estimate of expected return for stocks in hand, we now turn to the final necessary input, the expected return spread. While the traditional model subtracts the return for stocks from the risk-free asset (typically 90-day Treasury Bills), CCM considers this approach short-sighted, as we invest in a binary environment where our investable asset classes are stocks and intermediate- to long-term bonds (cash-like securities such as 90-day Treasury Bills are a rarity in our decision mix).
To keep the analysis on an apples-to-apples basis, we subtract the yield on long-term corporate bonds (specifically those from the industrials sector) from the expected return of stocks. A benefit of this approach is that long-term corporate bonds include a premium for default risk. This risk increases as the economic outlook deteriorates and long-term corporate bond yields increase correspondingly, thereby decreasing the equity return spread. This instills a bias towards less equity exposure when the corporate environment is deteriorating. As of 2/28/22, the yield for long-term corporate industrial bonds stands at 3.4%. Subtract from an expected return for stocks of 10.4% and the current expected return spread for stocks is a robust 7.0%.
The CCM Equity Risk Premium Model: CCM maintains a dataset of expected return calculations going back to 1973. From that data we calculate the long-term average expected return spread, which currently stands at 3.6%. We also calculate the standard deviation, which is a statistical measure of the dispersion of the data points around the average. We then plot the expected return spreads, the long-term average, and plus-one, plus-two, minus-one, minus-two standard deviations around the average. Below is the 2/28/22 update of our model:
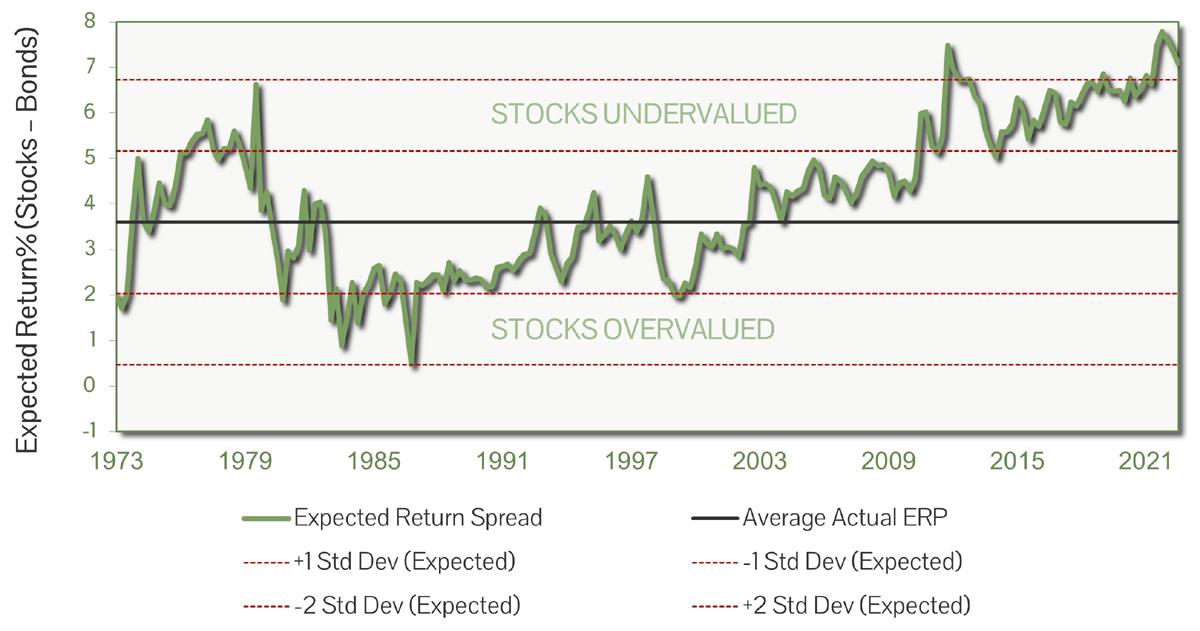
Investment Implications: As seen in the chart, stocks have offered an expected return well above the long-term average since the end of the Great Financial Crisis. Accordingly, CCM has remained true to our discipline and overweighted equities in balanced portfolios for the duration. In a testament to the efficacy of the system, stocks have outperformed bonds in eleven of the thirteen years. Adding even stronger credence, since 1973 stocks have outperformed bonds by an average 9.7% in the ensuing year when their return spread exceeded one standard deviation above the mean.
CCM’s model has been particularly useful in the past two years dominated by COVID. While a qualitative model may have been undermined by the pervasive amount of fear during such an unprecedented global pandemic, our quantitative model kept us fully invested in stocks. Since the onset of COVID the equity return spread has hovered near all-time highs, and S&P 500 stocks have delivered returns of 18.4% in 2020 and 28.7% in 2021. Meanwhile, bond returns have lagged those from stocks by a cumulative 45% over the two-year period.
Looking ahead, while the expected return spread for equities remains near its recent all-time high, it has tightened significantly since the beginning of the year. This was initially the result of higher long-term interest rates, but it has since been compounded by a lower expected return for stocks due to the economic knock-on effects from Russia’s invasion of Ukraine. Our long-term outlook for stocks remains bullish, but as conservative investment managers we believe a reduction in the risk profile of balanced portfolios is warranted given the severity of the geopolitical situation.
CCM Investment Advisers, LLC is a Registered Investment Adviser registered with the U.S. Securities and Exchange Commission (CRD# 105743). The opinions and information contained in this report are for informational purposes only and are not meant to be predictors of future results. Such opinions and information do not constitute an offer or solicitation to provide investment advisory services. Such an offer can only be made in states where CCM Investment Advisers is registered. CCM Investment Advisers does not assume liability for any loss which may result from the reliance by any person upon such information or opinions.
Any type of investing involves risk of loss and there are no guarantees that the strategies described may be successful. Any performance data reported represents historical data and future returns may differ significantly. Past performance does not guarantee future results.
Security, index and economic information are obtained from resources which CCM believes to be accurate but no warrant is made to the accuracy or completeness of the information. Various indices described and discussed herein are unmanaged; investments cannot be made directly into an index.
The S&P 500 Index ® is a readily available, capitalization-weighted index of 500 stocks. The index is designed to measure performance of the broad domestic economy through changes in the aggregate market value of 500 stocks representing all major industries.
The NASDAQ Composite Index is a readily available, capitalization-weighted index of over 2,500 domestic and international companies listed on the NASDAQ Stock Market.
The Barclay’s Government/Credit Index is the non-securitized component of the U.S. Aggregate Index. The index includes US Treasuries, government-related issues and corporate bonds
The ICE BofAML 0-3 Month US Treasury Bill Index is a subset of ICE BofAML US Treasury Bill Index including all securities with a remaining term to final maturity less than 3 months.
All blended benchmarks are static blends.
Technical Terms (definitions sourced from Investopedia)
The term federal funds rate refers to the target interest rate set by the Federal Open Market Committee (FOMC). This target is the rate at which commercial banks borrow and lend their excess reserves to each other overnight.
The Consumer Price Index (CPI) is a measure of the monthly change in prices paid by consumers. The CPI consists of a bundle of commonly purchased goods and services. The Bureau of Labor Statistics (BLS) calculates the CPI as a weighted average of prices for a basket of goods and services representative of aggregate U.S. consumer spending.
The Producer Price Index (PPI) measures the average change over time in the prices domestic producers receive for their output. It is a measure of inflation at the wholesale level that is compiled from thousands of indexes measuring producer prices by industry and product category. The index is published monthly by the U.S. Bureau of Labor Statistics (BLS)


