Understanding the CCM Asset Allocation Model
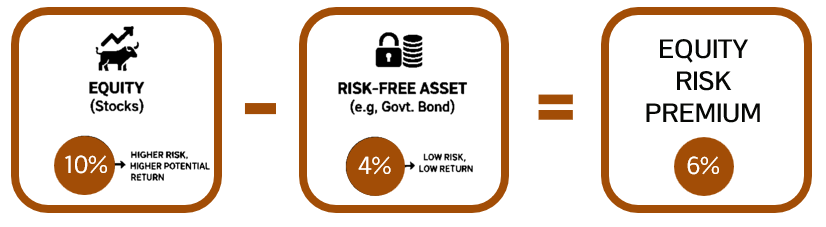
At CCM, the primary metric we use in determining our asset allocation strategy is the Equity Risk Premium (ERP). This fundamental financial concept measures the “extra” return investors demand to hold stocks instead of “risk-free” assets, such as U.S. Treasuries. Since stocks are inherently more volatile than bonds, investors require this premium to compensate for the higher risk of capital loss.
How the Model Works: Transitioning from History to Forecasting
Traditionally, the Equity Risk Premium is a backward-looking metric. For example, if the stock market previously returned 10% and the risk-free rate was 4%, the realized premium would be 6%.
To turn this into a forecasting tool, CCM shifts the focus from past performance to future expectations:
- Projecting Stock Returns: We estimate the “expected return” of the stock market using the Dividend Discount Model (DDM). This model assumes a stock’s value is the sum of all its future dividends, translated into today’s dollars.
- Addressing Non-Dividend Payers: Because many companies do not pay dividends or have fluctuating payouts, we use “implied dividends”—an estimate of a corporation’s total dividend-paying capacity—to ensure the model remains accurate for the entire market.
- A Better Benchmark: While most practitioners use U.S. Treasury Bonds as their baseline, CCM uses the yield on long-term Industrial bonds. We believe this provides a more realistic comparison because it incorporates the actual risk factors currently affecting the corporate sector.
Analyzing the Data: Signals and Strategy
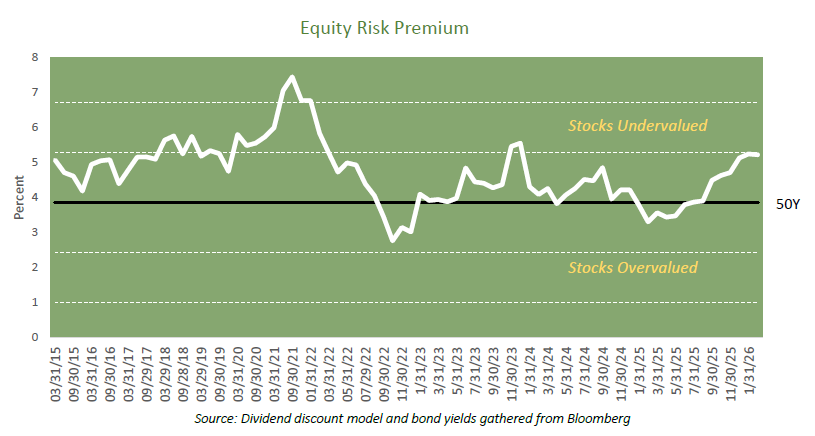
We track these equity risk premiums over a 50-year historical period, where the long-term average currently stands at 3.85%.
To identify potential actionable opportunities, we use Standard Deviation (a statistical measure of how far data points stray from the average).
- Neutral Zone: When the premium is near the 3.85% average, markets are considered fairly valued.
- High Confidence/Actionable Zones: When the data moves more than one standard deviation above or below the average, it triggers a “high confidence” signal for our asset allocation system that dictates action.
Current Outlook: Opportunities in 2026
In early 2025, our model signaled that stocks were becoming overvalued. In response, we reduced equity exposure in our balanced accounts to match their benchmarks. As we enter 2026, the landscape has shifted significantly. Stocks have moved from being slightly overvalued last spring to significantly undervalued today based on the equity risk premium metric. This is almost entirely the result of relentlessly strong growth in corporate profits (particularly in the technology sector).
Consistent with these signals and our Investment Committee’s assessment of other factors such as our outlook for the economy and interest rates, we have adjusted our strategy:
- Action: We are currently allowing equity exposure to drift +5% to 10% above their target benchmark weightings.
- Rationale: The current high risk premium suggests that investors are being well-compensated for taking on stock market risk at these price levels.
CCM Investment Advisers, LLC is a Registered Investment Adviser registered with the U.S. Securities and Exchange Commission (CRD# 105743). Any type of investing involves risk of loss and there are no guarantees that the strategies described on this website or any of the associated literature may be successful. The opinions and information contained in this report are for informational purposes only and are not meant to be predictors of future results. Such opinions and information do not constitute an offer or solicitation to provide investment advisory services. Such an offer can only be made in states where CCM Investment Advisers is registered.
Any type of investing involves risk of loss and there are no guarantees that the strategies described may be successful. Any performance data reported represents historical data and future returns may differ significantly. Past performance does not guarantee future results. CCM Investment Advisers does not assume liability for any loss which may result from the reliance by any person upon such information or opinions.
Security, index and economic information are obtained from resources which CCM believes to be accurate but no warrant is made to the accuracy or completeness of the information. Various indices described and discussed herein are unmanaged; investments cannot be made directly into an index. Indices do not incur fees that reduce performance. The performance and volatility of an index or mix of indices will not be the same as a CCM client account.
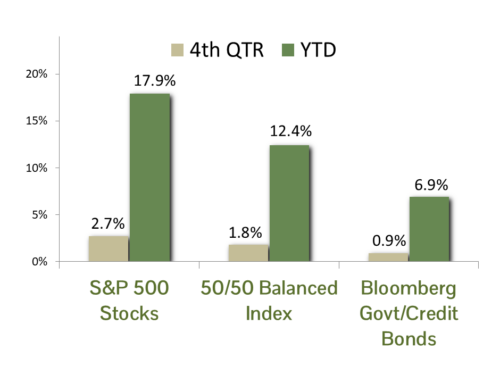
The S&P 500 Index ® is a readily available, capitalization-weighted index of 500 stocks. The index is designed to measure performance of the broad domestic economy through changes in the aggregate market value of 500 stocks representing all major industries.
The Magnificent Seven are the seven largest stocks as measured by market capitalization in the United States. The Bloomberg Magnificent 7 Total Return Index is an equal-dollar weighted equity benchmark consisting of a fixed basket of the seven largest market capitalization companies classified in the United States.
The Barclay’s Government/Credit Index is the non-securitized component of the U.S. Aggregate Index. The index includes US Treasuries, government-related issues and corporate bonds.
Corporate bonds returns and U.S. Government bond returns reference the Bloomberg U.S. Corporate Total Return Index and Bloomberg U.S. Government Total Return Index, respectively.
The 50/50 Balanced Index is an index comprised of 50% S&P 500 stocks and 50% Barclay’s Government/Credit Index bonds.
The NASDAQ Composite Index is a readily available, capitalization-weighted index of over 2,500 domestic and international companies listed on the NASDAQ Stock Market.
Equity index valuation and earnings statistics are calculated using the Bloomberg Professional Service unless otherwise indicated.
All blended benchmarks are static blends.
Technical Terms:
The Dividend Discount Model is a quantitative model used to predict the price of stocks based on the theory its price worth the sum of all future dividends discounted back to their present value.
The term equity risk premium refers to the excess return over bonds that investors demand to compensate for the greater risk for stocks.