MARKET SUMMARY: The benchmark S&P 500 index experienced two bouts of investor unrest in the third quarter, primarily due to concerns with the “carry trade.” Carry traders borrow cheaply in low-yielding currencies like the Japanese yen and buy assets in higher-yielding currencies such as the U.S. dollar. As the Bank of Japan began raising interest rates and the Fed signaled imminent rate cuts, the yen/dollar carry trade started to unwind in August, leading to a roughly 8% decline in S&P 500 stocks as dollar positions were closed out.
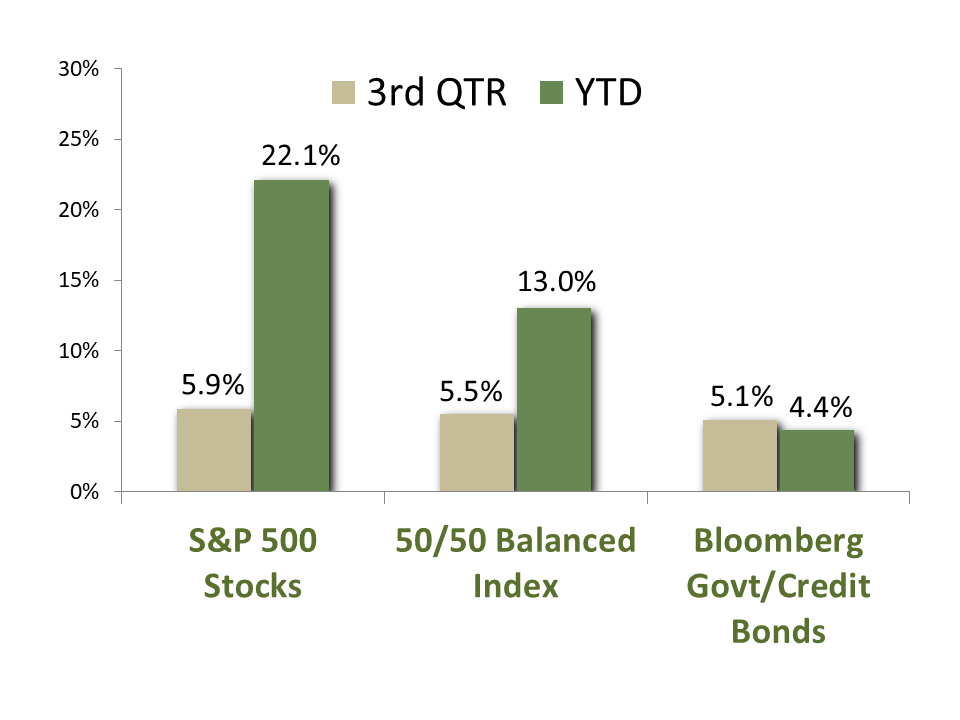
The prospect of lower U.S. rates amid continued economic strength ultimately carried the quarter for stock investors though. The S&P 500 rallied to close the quarter with a 5.9% return, boosting its year-to-date gain to an impressive 22.1%. Due to declining interest rates, utility stocks are the top-performing sector for the year, posting a total return of 30.6%. However, the group comprises only 2.4% of the index and is barely able to move the needle. With a market capitalization of over 30% of the entire S&P 500, the “Magnificent 7” technology stocks certainly can. As measured by the UBS Magnificent 7 index, the group posted a 35.1% gain for the year. The high concentration of return in those seven names continues to make it challenging for diversified equity portfolios to fully match the index’s performance. Nonetheless, it has been an outstanding year for stock investors.
Progress in the fight against inflation and increasing signals that the Federal Reserve was ready to begin lowering interest rates were favorable tailwinds for bonds in the third quarter. The main debate among market participants was “when” and “how much” regarding Fed easing. Investors were rewarded with a half-percent cut in the Fed Funds rate at the Fed’s September 17-18 meeting – generally in line with what the market had priced in. As measured by the benchmark Bloomberg Government/Credit index, bonds gained 5.1% during the third quarter. This reversed their earlier YTD loss to a positive 4.4% total return for the year through September 30.
ECONOMIC FORECAST: Economic growth remained strong throughout the third quarter, effectively eliminating concerns of a hard-landing scenario. Key drivers of growth include capital and infrastructure investments, domestic manufacturing (“onshoring”), and resilient consumer spending that has continued despite higher prices. Employers are still adding jobs, although slower than in the year’s first half. Slower hiring combined with low claims for unemployment benefits points to a cautious business environment going into the presidential election. We believe that growth will continue once corporations have more clarity on the economic policy of the new administration.
The U.S. housing sector has been a weak spot in the economy for the past 18 months. Higher interest rates and reduced affordability following the post-COVID boom have sidelined many potential buyers. We expect the industry’s fortunes to change for the positive over the coming years. Mortgage rates have fallen 1.25% from their highs as expectations have increased for a lower Fed Funds Rate. Home affordability and increased home ownership are likely to be key priorities for the next administration. We expect the industry to be a key driver in the next leg up of economic growth.
FIXED INCOME STRATEGY: The bond market gave investors a reason to cheer, as each month of the third quarter was punctuated by positive total returns. Credit spreads on investment-grade corporate bonds continued to modestly tighten over the quarter, while interest rates declined across the yield curve. In aggregate, this was enough to lift YTD returns firmly back into positive territory.
We continue to favor an approach that barbells corporate bond exposure in shorter maturities (5 years or less) with U.S. Government bond exposure in the 5-10 year maturity range. This provides an embedded hedge against both any potential equity market weakness and reduces the effect of any spread-widening in corporate bonds, as spreads remain tight by historical standards.
As we head into the final quarter of 2024, we continue to view the risk-reward setup for fixed income investors as constructive. While we may not see another 0.50% reduction in the policy rate, we believe we will likely see at least one more 0.25% decrease in 2024. The Federal Reserve’s September “dot plot” indicated 2.50% in interest rate cuts by year-end 2026 (including September’s 50 basis point cut). Although this is only a prediction, this backdrop should confidently keep the wind in bond investors’ sails.
EQUITY STRATEGY: Recent market trends have shown an encouraging broadening of leadership beyond the “Magnificent 7” tech giants. Traditionally defensive sectors such as utilities and industrials are now delivering strong performance, driven by lower interest rates and renewed capital investment. As risk-conscious managers, we welcome this diversification in market performance, as it signals a healthier balance across sectors.
While market valuations remain above historical averages, this is occurring in an environment of rising earnings and expanding operating margins. Pre-pandemic, non-financial company margins were in the 9-10% range, but they currently exceed 15%, with expectations for further increases. Research by Bank of America highlights that Artificial Intelligence (AI) is poised to increase margins across nearly all industries, though some will benefit more than others. Long-term market performance is closely tied to earnings growth, reinforcing our confidence that the bull market, which began in 2022, has room to run.
One of the most trusted economists that we follow, Dr. Edward Yardeni, forecasts a “Roaring 2020’s” scenario which draws a parallel between today’s technological advancements—AI, automation, healthcare innovations, and biotechnology—and the transformative innovations of the 1920’s, such as electrification, standardized manufacturing, and telecommunications. While these new technologies are still in their early stages, they hold significant potential for driving long-term growth. We are cognizant of risks to this positive economic outcome including rising political tensions, budget deficits, and geopolitical concerns. And while these challenges are real, we believe the economic benefits of innovation may ultimately outweigh the risks in the years ahead.
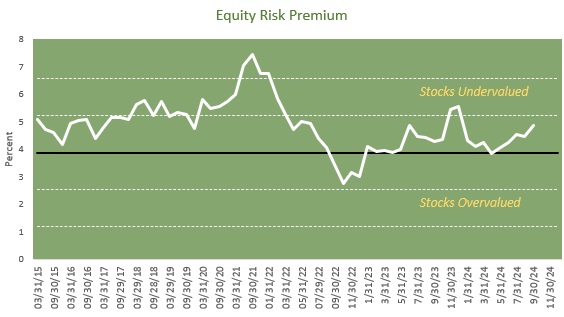
ASSET ALLOCATION: Since the end of the first quarter the expected return spread between stocks and bonds has steadily moved in favor of stock exposure in balanced portfolios. The propellant is improvement in both factors that comprise the Equity Risk Premium Model, the expected return for stocks (derived from a valuation model known as the Dividend Discount Model) and the yield on long-term corporate bonds (we specifically use industrial bonds due to their economic sensitivity).
Due to forecasts for a virtuous cycle of continued economic strength, ensuing corporate profitability and the implication for higher dividends, the expected return for stocks has widened to over 10% – just ahead of the 9.88% level it has averaged over the past twenty years. Meanwhile, long-term industrial bond yields have declined to 5.18% – below their 5.46% 20-year average. We do not put blind trust in the output of a quantitative financial model, but after blending with the results of our qualitative research on the economy and markets (where we are quite optimistic), we are increasingly confident that a modest overweight in high-quality equities in balanced portfolios is the most prudent investment decision.
Key risks to our strategic positioning include the upcoming election (although history shows stock market performance is hardly affected by party affiliation), a heated geopolitical situation (particularly in the Middle East, Ukraine and the South China Sea), a dearth of plans to address the growing U.S. budget deficit, and the possibility of an inflation rebound or an unexpected economic downturn. We are aware of these risks and mitigate them by focusing on high-quality large-cap stocks and maintaining a defensive bond position. If your tolerance for such risks or any other circumstances have changed, please feel free to contact us.
CCM Investment Advisers, LLC is a Registered Investment Adviser registered with the U.S. Securities and Exchange Commission (CRD# 105743). Any type of investing involves risk of loss and there are no guarantees that the strategies described on this website or any of the associated literature may be successful. The opinions and information contained in this report are for informational purposes only and are not meant to be predictors of future results. Such opinions and information do not constitute an offer or solicitation to provide investment advisory services. Such an offer can only be made in states where CCM Investment Advisers is registered.
Any type of investing involves risk of loss and there are no guarantees that the strategies described may be successful. Any performance data reported represents historical data and future returns may differ significantly. Past performance does not guarantee future results. CCM Investment Advisers does not assume liability for any loss which may result from the reliance by any person upon such information or opinions.
Security, index and economic information are obtained from resources which CCM believes to be accurate but no warrant is made to the accuracy or completeness of the information. Various indices described and discussed herein are unmanaged; investments cannot be made directly into an index. Indices do not incur fees that reduce performance. The performance and volatility of an index or mix of indices will not be the same as a CCM client account.
The S&P 500 Index ® is a readily available, capitalization-weighted index of 500 stocks. The index is designed to measure performance of the broad domestic economy through changes in the aggregate market value of 500 stocks representing all major industries.
The S&P 500 Growth Index ® is a stock index administered by Standard & Poor’s-Dow Jones Indices. As its name suggests, the purpose of the index is to serve as a proxy for growth companies included in the S&P 500. The index identifies growth stocks using three factors: sales growth, the ratio of earnings change to price, and momentum.
The S&P 500 Value Index ® is a stock index administered by Standard & Poor’s-Dow Jones Indices. As its name suggests, the purpose of the index is to serve as a proxy for value companies included in the S&P 500. The index identifies growth stocks using three factors: the ratios of book value, earnings, and sales to price.
The UBS Magnificent 7 Index tracks a group of 7 of the largest mega cap tech stocks listed in the US. The stocks mirror their respective S&P 500 weight and are reweighted pro-rata. Created in Oct 2023. Rebalanced and reconstituted semi-annually.
The Barclay’s Government/Credit Index is the non-securitized component of the U.S. Aggregate Index. The index includes US Treasuries, government-related issues and corporate bonds.
The 50/50 Balanced Index is an index comprised of 50% S&P 500 stocks and 50% Barclay’s Government/Credit Index bonds.
The NASDAQ Composite Index is a readily available, capitalization-weighted index of over 2,500 domestic and international companies listed on the NASDAQ Stock Market.
All blended benchmarks are static blends.
Technical Terms:
The term federal funds rate refers to the target interest rate set by the Federal Open Market Committee (FOMC). This target is the rate at which commercial banks borrow and lend their excess reserves to each other overnight.
The Atlanta Fed GDPNow model is a real-time econometric model which forecasts GDP growth in the current quarter.
The Dividend Discount Model is a quantitative model used to predict the price of stocks based on the theory its price worth the sum of all future dividends discounted back to their present value.
The Consumer Price Index (CPI) is a measure of the monthly change in prices paid by consumers. The CPI consists of a bundle of commonly purchased goods and services. The Bureau of Labor Statistics (BLS) calculates the CPI as a weighted average of prices for a basket of goods and services representative of aggregate U.S. consumer spending.
The term duration measures how long it takes in years for an investor to be re-paid a bond’s price by the bond’s total cash flows. Duration can also measure the sensitivity of a bond’s or fixed income portfolio’s price to changes in interest rates.
The term equity risk premium refers to the excess return over bonds that investors demand to compensate for the greater risk for stocks.


