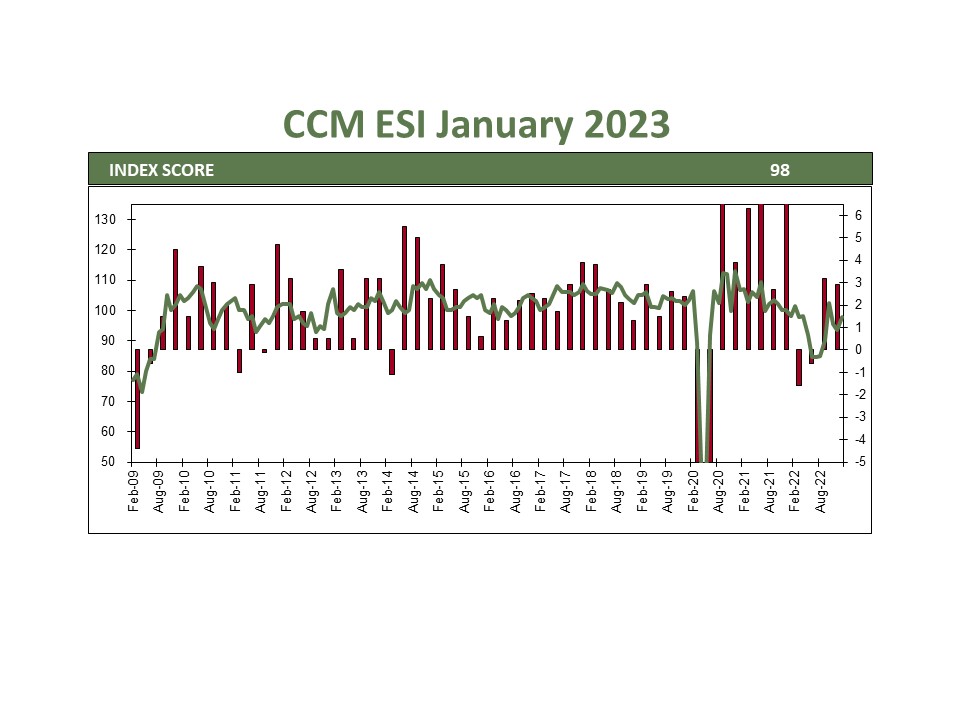
Overall Consumer Confidence: 107 | Present Situation: 151 | Expectations: 78
The economy is strong by almost any objective measure, but consumers continue to sour in their outlook. We view inflation as the most likely culprit for the dreadful mood in sentiment. The disjunction of hard and soft data is confounding to economists, making it difficult to place odds on the US escaping the Fed’s rate hiking cycle without a recession. We are partial to the idea of a “rolling recession,” as opposed to an economy-wide recession, being the most likely outcome. Here are some sectors that have waned in an otherwise healthy economy.
- The housing market cratered over the past year as mortgage rates soared.
- The manufacturing sector softened in late 2022 as consumers shifted their expenditures to services over goods.
- Most recently, layoffs at technology firms point to a weaker operating environment in computers and tech services.
Fortunately, there have been offsetting areas of strength in various sectors, including multi-family housing construction, consumer travel & experience, and infrastructure investment, to name a few.
January Payrolls: 517k |Unemployment: 3.4% (50y Low) | Jobs per Unemployed: 1.9
Our belief in avoiding a recession is based mainly on the resilient US labor market. The shrinking US labor pool will make companies hesitant to lay off workers in a mild downturn. While the effects of inflation are dampening sentiment, pay increases, in the aggregate, have largely kept pace with prices. While we remain optimistic, the most significant risk to our outlook is a re-acceleration of inflation. Dwindling pandemic savings, higher credit card spending, and increasing savings rates all point to a strained consumer. We are hopeful that the disinflation trend seen since last summer will continue, allowing consumers to regain some breathing room in their budgets.
Q4 GDP: 2.9% | Productivity: 3% | ISM Manufacturing: 47.4 | ISM Services: 55.2
2022 got off to a slow start led by two quarters of contraction, yet economic growth finished the year strong, bringing the full-year number to a respectable 2.1%. We were amazed at the resilience given the challenges faced by businesses.
- Annual inflation, as measured by headline CPI, peaked in June at 9.1% but trended down to 6.5% by December, when we saw the first monthly decline in CPI since 2018.
- Interest rates more than doubled last year as the Fed hiked rates at the fastest pace since the 1980s.
- All this while operating with sub-optimal supply chains and a war that threatened to upend a burgeoning European recovery.
The current outlook for growth in 2023 is a paltry .5%. The fact that many of these constraints outlined above are easing gives us hope that we may see above consensus growth this year.
Bottom Line
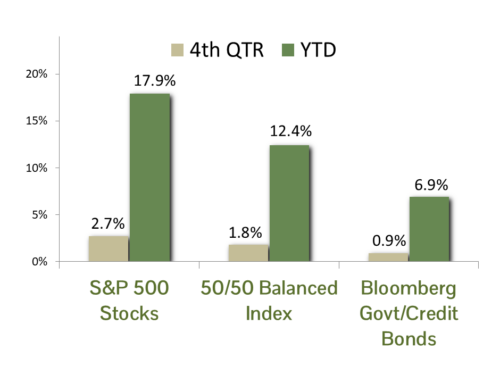
The US economy grew at a solid pace last year despite numerous headwinds. Inflation not seen in 40+ years dampened consumer outlooks causing many to turn cautious as prices continued to surge. Prices are on a 6-month downtrend which should brighten moods going to 2023. Businesses are feeling upbeat as hiring continues at an above-trend pace. Markets are indicating that the worse is behind us with the S&P 500 up 15% off recent lows and 10-year yields down over 60 bps. Economists are predicting a slow growth year, but we are likely to see estimates grow as inflation continues its downward trend allowing the Fed to pause rate hikes.
CCM Investment Advisers, LLC is a Registered Investment Adviser registered with the U.S. Securities and Exchange Commission (CRD# 105743). The opinions and information contained in this report are for informational purposes only and are not meant to be predictors of future results. Such opinions and information do not constitute an offer or solicitation to provide investment advisory services. Such an offer can only be made in states where CCM Investment Advisers is registered. CCM Investment Advisers does not assume liability for any loss which may result from the reliance by any person upon such information or opinions.
Any type of investing involves risk of loss and there are no guarantees that the strategies described may be successful. Any performance data reported represents historical data and future returns may differ significantly. Past performance does not guarantee future results.
Security, index and economic information are obtained from resources which CCM believes to be accurate but no warrant is made to the accuracy or completeness of the information. Various indices described and discussed herein are unmanaged; investments cannot be made directly into an index.
The S&P 500 Index ® is a readily available, capitalization-weighted index of 500 stocks. The index is designed to measure performance of the broad domestic economy through changes in the aggregate market value of 500 stocks representing all major industries.
The NASDAQ Composite Index is a readily available, capitalization-weighted index of over 2,500 domestic and international companies listed on the NASDAQ Stock Market.
The Barclay’s Government/Credit Index is the non-securitized component of the U.S. Aggregate Index. The index includes US Treasuries, government-related issues and corporate bonds
The ICE BofAML 0-3 Month US Treasury Bill Index is a subset of ICE BofAML US Treasury Bill Index including all securities with a remaining term to final maturity less than 3 months.
All blended benchmarks are static blends.
Technical Terms (definitions sourced from Investopedia)
The term federal funds rate refers to the target interest rate set by the Federal Open Market Committee (FOMC). This target is the rate at which commercial banks borrow and lend their excess reserves to each other overnight.
The Consumer Price Index (CPI) is a measure of the monthly change in prices paid by consumers. The CPI consists of a bundle of commonly purchased goods and services. The Bureau of Labor Statistics (BLS) calculates the CPI as a weighted average of prices for a basket of goods and services representative of aggregate U.S. consumer spending.
The Producer Price Index (PPI) measures the average change over time in the prices domestic producers receive for their output. It is a measure of inflation at the wholesale level that is compiled from thousands of indexes measuring producer prices by industry and product category. The index is published monthly by the U.S. Bureau of Labor Statistics (BLS)


