May Unemployment Rate 3.6%
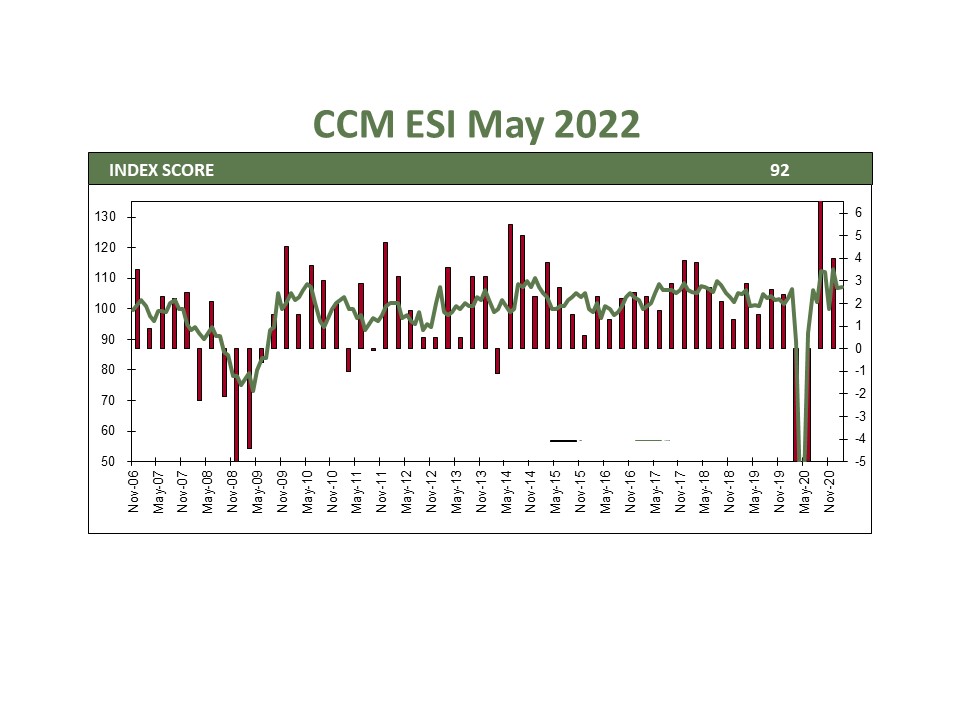
The May jobs report confirmed that the economy is still growing, although at a more muted pace. The addition of 390,000 jobs this month, while above the consensus estimate, was the lowest since April 2021. The unemployment rate held at 3.6%, with 321,000 additional workers entering the workforce. Wage growth, while still strong, slowed to 4.5% at an annual rate, down from 6% in 2021. Markets primarily took the latest report as a sign of continued strength and gave the fed more reason to continue their interest rate increases.
Hiring Woes
While the latest employment report showed strength, there are a few gathering clouds. Retail earnings were weaker in the second quarter, with Walmart and Target impacted by higher labor costs. As a group, they cut 60,700 jobs in May as many were overstaffed. Several technology firms instituted a hiring freeze until the economic outlook becomes clearer. Elon Musk recently emailed executives at Tesla that he would like to cut 10% of the current workforce also on economic concerns. We need to see more evidence, but we may be in for a pause in job market improvement over the coming months.
Consumers Stretched
Consumers are showing signs of being stretched financially. While spending remains robust, even after adjusting for inflation, it is increasingly being fueled by savings. The latest surveys show little current concern over employment and wages, yet the 6-month outlook has soured markedly. High gas prices have an outsized effect on consumer sentiment, and we see few signs of prices coming down, at least through the summer. If high prices continue into the fall or surge from current levels, it will be difficult to avoid a recession.
ISM Manufacturing: 56.1% ISM Services: 55.9%
The latest ISM surveys showed continued strength in most facets of businesses. Inventory sentiment improved and lead times for orders trended down, both signs of an improving supply chain. Companies continue to have trouble finding workers, with some deciding to hold off on additional workers until the job market weakens. The prices paid component, while still elevated, eased for both surveys in May.
Market Mood
The market’s fate largely rests with how skillfully the Fed threads the interest rate needle. Currently, we are in a ‘good news is bad news’ cycle where interest rates increase, and equity markets fall on days economic news comes out stronger than expected. Investor logic seems to be that better economic news gives the Fed a reason to be more aggressive in raising rates to quell economic growth. We see several signs that inflation has peaked and could begin rolling over in the coming months. Rates are too low even assuming inflation moves back to the 2% Fed target. We are not concerned with the current path of rate increases and the Fed has a better than even chance of avoiding a recession if they remain patient.
Bottom Line
The next few months will be vital to the market’s direction for the remainder of the year. The key issues are the labor market, gas prices, and the Fed. Many dislocations in the labor market remain and could affect aggregate wage growth, company profit margins, and total economic output. We are concerned about higher gas prices crimping consumer spending and draining the safety net built during the pandemic. A cessation of hostilities in Ukraine or additional OPEC output would go a long way to help ease prices. Additionally, the Fed is walking a tight rope to reduce demand enough to rein in inflation while keeping the economy from recession. We see a path for steady growth for the remainder of the year, but the ride could be bumpy.
CCM Investment Advisers, LLC is a Registered Investment Adviser registered with the U.S. Securities and Exchange Commission (CRD# 105743). The opinions and information contained in this report are for informational purposes only and are not meant to be predictors of future results. Such opinions and information do not constitute an offer or solicitation to provide investment advisory services. Such an offer can only be made in states where CCM Investment Advisers is registered. CCM Investment Advisers does not assume liability for any loss which may result from the reliance by any person upon such information or opinions.
Any type of investing involves risk of loss and there are no guarantees that the strategies described may be successful. Any performance data reported represents historical data and future returns may differ significantly. Past performance does not guarantee future results.
Security, index and economic information are obtained from resources which CCM believes to be accurate but no warrant is made to the accuracy or completeness of the information. Various indices described and discussed herein are unmanaged; investments cannot be made directly into an index.
The S&P 500 Index ® is a readily available, capitalization-weighted index of 500 stocks. The index is designed to measure performance of the broad domestic economy through changes in the aggregate market value of 500 stocks representing all major industries.
The NASDAQ Composite Index is a readily available, capitalization-weighted index of over 2,500 domestic and international companies listed on the NASDAQ Stock Market.
The Barclay’s Government/Credit Index is the non-securitized component of the U.S. Aggregate Index. The index includes US Treasuries, government-related issues and corporate bonds
The ICE BofAML 0-3 Month US Treasury Bill Index is a subset of ICE BofAML US Treasury Bill Index including all securities with a remaining term to final maturity less than 3 months.
All blended benchmarks are static blends.
Technical Terms (definitions sourced from Investopedia)
The term federal funds rate refers to the target interest rate set by the Federal Open Market Committee (FOMC). This target is the rate at which commercial banks borrow and lend their excess reserves to each other overnight.
The Consumer Price Index (CPI) is a measure of the monthly change in prices paid by consumers. The CPI consists of a bundle of commonly purchased goods and services. The Bureau of Labor Statistics (BLS) calculates the CPI as a weighted average of prices for a basket of goods and services representative of aggregate U.S. consumer spending.
The Producer Price Index (PPI) measures the average change over time in the prices domestic producers receive for their output. It is a measure of inflation at the wholesale level that is compiled from thousands of indexes measuring producer prices by industry and product category. The index is published monthly by the U.S. Bureau of Labor Statistics (BLS)


