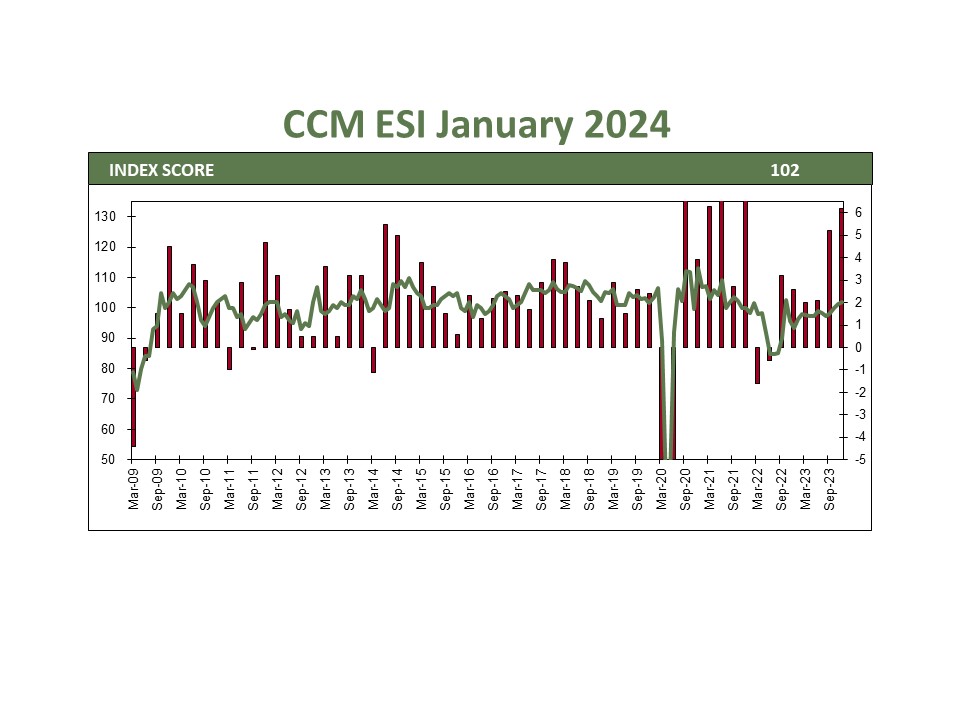
The economy grew at 3.3% in the last quarter of 2023, bringing the full year to 3.1%. January’s economic releases demonstrate that the strength we saw toward the end of last year is only intensifying. The latest Atlanta Fed GDPNow expects growth in the first quarter to be 3.4%. Let’s review some of the latest data and what it might mean for growth and the Fed.
ISM Surveys: The latest ISM Manufacturing (ISM-M) survey reached a 15-month high of 49.1%. While still not in expansion territory, the sub-indices within the ISM-M point to a resurgence in production. ISM Non-Manufacturing (ISM-NM) surged above all estimates to 53.4, with almost every component improving. One item we are watching within both releases is the prices paid component. Prices had been trending down, but worries over higher shipping costs due to the conflict in the Red Sea may be leading to worries of a return to inflation.
Consumer Confidence: We have discussed the significant impact of inflation on consumers’ outlook. The latest consumer confidence of 114.8%, is the highest level since August 2021, as inflation growth appears to be downward. While not at pre-pandemic levels, prices on groceries and gasoline are down substantially from their highs. Additionally, wages in the past few months have outpaced price increases, allowing consumers to breathe a sigh of relief. Strong consumer spending on entertainment and travel strengthened throughout 2023 and should continue as long as employment remains robust.
Employment: January’s employment report exceeded expectations, with 353k jobs added. Even more impressive, over half a million people could not work in January because of harsh weather. Wages grew in January at the fastest pace in 22 months, at .55%. Various tech companies and UPS have announced several high-profile layoffs, but the totals are well below what we saw at the same time last year.
Good News = Bad News?: While the economy is off to a great start, markets have experienced their largest downturn on the back of strong economic releases. The Fed has indicated they want more evidence that inflation is on a sustainable downward trend before cutting benchmark interest rates. The fed futures market has reduced the expected cuts from six to four. We believe inflation will likely continue to trend down, but predicting the Fed’s behavior is a fool’s errand. Strong market fundamentals should support growth even at higher interest rates.
CCM Investment Advisers, LLC is a Registered Investment Adviser registered with the U.S. Securities and Exchange Commission (CRD# 105743). Any type of investing involves risk of loss and there are no guarantees that the strategies described on this website or any of the associated literature may be successful. The opinions and information contained in this report are for informational purposes only and are not meant to be predictors of future results. Such opinions and information do not constitute an offer or solicitation to provide investment advisory services. Such an offer can only be made in states where CCM Investment Advisers is registered.
Any type of investing involves risk of loss and there are no guarantees that the strategies described may be successful. Any performance data reported represents historical data and future returns may differ significantly. Past performance does not guarantee future results. CCM Investment Advisers does not assume liability for any loss which may result from the reliance by any person upon such information or opinions.
Security, index and economic information are obtained from resources which CCM believes to be accurate but no warrant is made to the accuracy or completeness of the information. Various indices described and discussed herein are unmanaged; investments cannot be made directly into an index.
The S&P 500 Index ® is a readily available, capitalization-weighted index of 500 stocks. The index is designed to measure performance of the broad domestic economy through changes in the aggregate market value of 500 stocks representing all major industries.
The S&P 500 Growth Index ® is a stock index administered by Standard & Poor’s-Dow Jones Indices. As its name suggests, the purpose of the index is to serve as a proxy for growth companies included in the S&P 500. The index identifies growth stocks using three factors: sales growth, the ratio of earnings change to price, and momentum.
The S&P 500 Value Index ® is a stock index administered by Standard & Poor’s-Dow Jones Indices. As its name suggests, the purpose of the index is to serve as a proxy for value companies included in the S&P 500. The index identifies growth stocks using three factors: the ratios of book value, earnings, and sales to price.
The Barclay’s Government/Credit Index is the non-securitized component of the U.S. Aggregate Index. The index includes US Treasuries, government-related issues and corporate bonds
The 50/50 Balanced Index is an index comprised of 50% S&P 500 stocks and 50% Barclay’s Government/Credit Index bonds.
The NASDAQ Composite Index is a readily available, capitalization-weighted index of over 2,500 domestic and international companies listed on the NASDAQ Stock Market.
The FANG+ Index is an equally-weighted index comprised of Meta, Apple, Amazon, Netflix, Microsoft, Alphabet, Tesla, NVIDIA, Snowflake and AMD. The index is rebalanced quarterly.
The UBS AI Winners basket tracks the performance of 40 US-listed stocks at the forefront of the Generative AI industry. Stock selection is based on input from UBS research analysts, specialty sales, and transcripts/reports. The basket has been optimized for liquidity with initial weights capped at 7% and trades $2.5bn in a day at 20% ADV.
All blended benchmarks are static blends.
Technical Terms:
The term federal funds rate refers to the target interest rate set by the Federal Open Market Committee (FOMC). This target is the rate at which commercial banks borrow and lend their excess reserves to each other overnight.
The Atlanta Fed GDPNow model is a real-time econometric model which forecasts GDP growth in the current quarter.
The Consumer Price Index (CPI) is a measure of the monthly change in prices paid by consumers. The CPI consists of a bundle of commonly purchased goods and services. The Bureau of Labor Statistics (BLS) calculates the CPI as a weighted average of prices for a basket of goods and services representative of aggregate U.S. consumer spending.
The term duration measures how long it takes, in years, for an investor to be repaid a bond’s price by the bond’s total cash flows. Duration can also measure the sensitivity of a bond’s or fixed income portfolio’s price to changes in interest rates.
The term equity risk premium refers to the excess return over bonds that investors demand to compensate for the greater risk for stocks.


